
Usually in this space I like to share interesting things that I find out; you might call it a research-epistle-publish loop. Today, though, I come not with answers, but with questions, or rather one…
Usually in this space I like to share interesting things that I find out; you might call it a research-epistle-publish loop. Today, though, I come not with answers, but with questions, or rather one question, but with fractal surface area: what is the value proposition of generational garbage collection?
hypothesis
The conventional wisdom is encapsulated in a 2004 Blackburn, Cheng, and McKinley paper, “Myths and Realities: The Performance Impact of Garbage Collection”, which compares whole-heap mark-sweep and copying collectors to their generational counterparts, using the Jikes RVM as a test harness. (It also examines a generational reference-counting collector, which is an interesting predecessor to the 2022 LXR work by Zhao, Blackburn, and McKinley.)
The paper finds that generational collectors spend less time than their whole-heap counterparts for a given task. This is mainly due to less time spent collecting, because generational collectors avoid tracing/copying work for older objects that mostly stay in the same place in the live object graph.
The paper also notes an improvement for mutator time under generational GC, but only for the generational mark-sweep collector, which it attributes to the locality and allocation speed benefit of bump-pointer allocation in the nursery. However for copying collectors, generational GC tends to slow down the mutator, probably because of the write barrier, but in the end lower collector times still led to lower total times.
So, I expected generational collectors to always exhibit lower wall-clock times than whole-heap collectors.
test workbench
In whippet, I have a garbage collector with an abstract API that specializes at compile-time to the mutator’s object and root-set representation and to the collector’s allocator, write barrier, and other interfaces. I embed it in whiffle, a simple Scheme-to-C compiler that can run some small multi-threaded benchmarks, for example the classic Gabriel benchmarks. We can then test those benchmarks against different collectors, mutator (thread) counts, and heap sizes. I expect that the generational parallel copying collector takes less time than the whole-heap parallel copying collector.
results?
So, I ran some benchmarks. Take the splay-tree benchmark, derived from Octane’s splay.js. I have a port to Scheme, and the results are... not good!
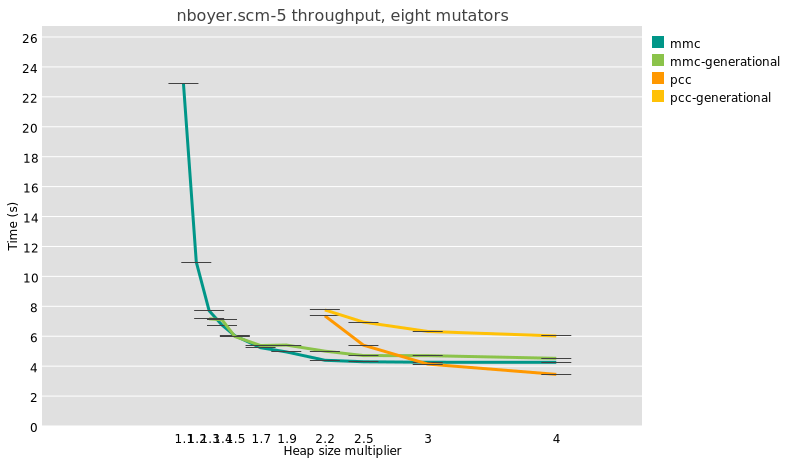
In this graph the “pcc” series is the whole-heap copying collector, and “generational-pcc” is the generational counterpart, with a nursery sized such that after each collection, its size is 2 MB times the number of active mutator threads in the last collector. So, for this test with eight threads, on my 8-core Ryzen 7 7840U laptop, the nursery is 16MB including the copy reserve, which happens to be the same size as the L3 on this CPU. New objects are kept in the nursery one cycle before being promoted to the old generation.There are also results for “mmc” and “generational-mmc” collectors, which use an Immix-derived algorithm that allows for bump-pointer allocation but which doesn’t require a copy reserve. There, the generational collectors use a sticky mark-bit algorithm, which has very different performance characteristics as promotion is in-place, and the nursery is as large as the available heap size.
The salient point is that at all heap sizes, and for these two very different configurations (mmc and pcc), generational collection takes more time than whole-heap collection. It’s not just the splay benchmark either; I see the same thing for the very different nboyer benchmark. What is the deal?
I am honestly quite perplexed by this state of affairs. I wish I had a narrative to tie this together, but in lieu of that, voici some propositions and observations.
“generational collection is good because bump-pointer allocation”
Sometimes people say that the reason generational collection is good is because you get bump-pointer allocation, which has better locality and allocation speed. This is misattribution: it’s bump-pointer allocators that have these benefits. You can have them in whole-heap copying collectors, or you can have them in whole-heap mark-compact or immix collectors that bump-pointer allocate into the holes. Or, true, you can have them in generational collectors with a copying nursery but a freelist-based mark-sweep allocator. But also you can have generational collectors without bump-pointer allocation, for free-list sticky-mark-bit collectors. To simplify this panorama to “generational collectors have good allocators” is incorrect.
“generational collection lowers pause times”
It’s true, generational GC does lower median pause times:
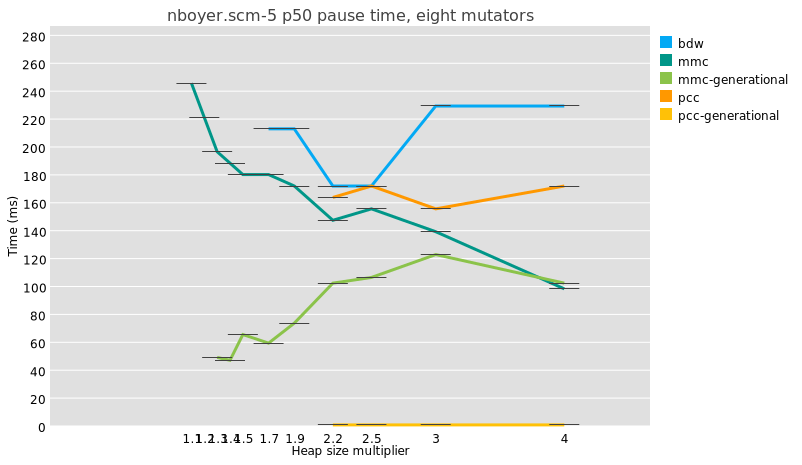
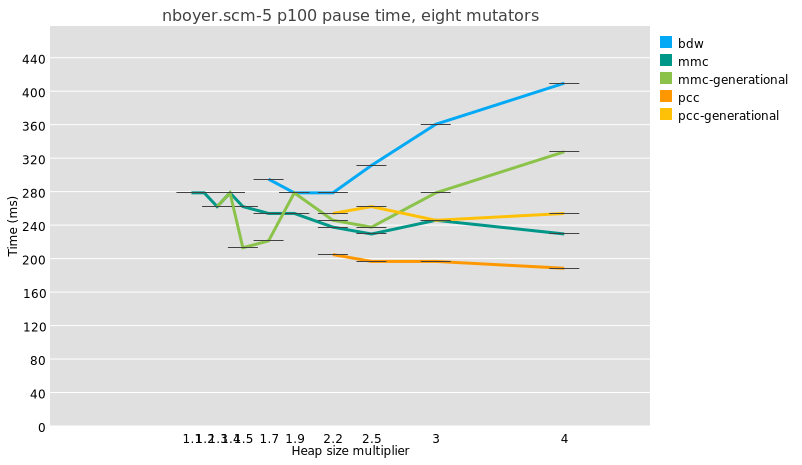
But because a major collection is usually slightly more work under generational GC than in a whole-heap system, because of e.g. the need to reset remembered sets, the maximum pauses are just as big and even a little bigger:
I am not even sure that it is meaningful to compare median pause times between generational and non-generational collectors, given that the former perform possibly orders of magnitude more collections than the latter.
Doing fewer whole-heap traces is good, though, and in the ideal case, the less frequent major traces under generational collectors allows time for concurrent tracing, which is the true mitigation for long pause times.
is it whiffle?
Could it be that the test harness I am using is in some way unrepresentative? I don’t have more than one test harness for Whippet yet. I will start work on a second Whippet embedder within the next few weeks, so perhaps we will have an answer there. Still, there is ample time spent in GC pauses in these benchmarks, so surely as a GC workload Whiffle has some utility.
One reasons that Whiffle might be unrepresentative is that it is an ahead-of-time compiler, whereas nursery addresses are assigned at run-time. Whippet exposes the necessary information to allow a just-in-time compiler to specialize write barriers, for example the inline check that the field being mutated is not in the nursery, and an AOT compiler can’t encode this as an immediate. But it seems a small detail.
Also, Whiffle doesn’t do much compiler-side work to elide write barriers. Could the cost of write barriers be over-represented in Whiffle, relative to a production language run-time?
Relatedly, Whiffle is just a baseline compiler. It does some partial evaluation but no CFG-level optimization, no contification, no nice closure conversion, no specialization, and so on: is it not representative because it is not an optimizing compiler?
is it something about the nursery size?
How big should the nursery be? I have no idea.
As a thought experiment, consider the case of a 1 kilobyte nursery. It is probably too small to allow the time for objects to die young, so the survival rate at each minor collection would be high. Above a certain survival rate, generational GC is probably a lose, because your program violates the weak generational hypothesis: it introduces a needless copy for all survivors, and a synchronization for each minor GC.
On the other hand, a 1 GB nursery is probably not great either. It is plenty large enough to allow objects to die young, but the number of survivor objects in a space that large is such that pause times would not be very low, which is one of the things you would like in generational GC. Also, you lose out on locality: a significant fraction of the objects you traverse are probably out of cache and might even incur TLB misses.
So there is probably a happy medium somewhere. My instinct is that for a copying nursery, you want to make it about as big as L3 cache, which on my 8-core laptop is 16 megabytes. Systems are different sizes though; in Whippet my current heuristic is to reserve 2 MB of nursery per core that was active in the previous cycle, so if only 4 threads are allocating, you would have a 8 MB nursery. Is this good? I don’t know.
is it something about the benchmarks?
I don’t have a very large set of benchmarks that run on Whiffle, and they might not be representative. I mean, they are microbenchmarks.
One question I had was about heap sizes. If a benchmark’s maximum heap size fits in L3, which is the case for some of them, then probably generational GC is a wash, because whole-heap collection stays in cache. When I am looking at benchmarks that evaluate generational GC, I make sure to choose those that exceed L3 size by a good factor, for example the 8-mutator splay benchmark in which minimum heap size peaks at 300 MB, or the 8-mutator nboyer-5 which peaks at 1.6 GB.
But then, should nursery size scale with total heap size? I don’t know!
Incidentally, the way that I scale these benchmarks to multiple mutators is a bit odd: they are serial benchmarks, and I just run some number of threads at a time, and scale the heap size accordingly, assuming that the minimum size when there are 4 threads is four times the minimum size when there is just one thread. However, multithreaded programs are unreliable, in the sense that there is no heap size under which they fail and above which they succeed; I quote:
"Consider 10 threads each of which has a local object graph that is usually 10 MB but briefly 100MB when calculating: usually when GC happens, total live object size is 10×10MB=100MB, but sometimes as much as 1 GB; there is a minimum heap size for which the program sometimes works, but also a minimum heap size at which it always works."
is it the write barrier?
A generational collector partitions objects into old and new sets, and a minor collection starts by visiting all old-to-new edges, called the “remembered set”. As the program runs, mutations to old objects might introduce new old-to-new edges. To maintain the remembered set in a generational collector, the mutator invokes write barriers: little bits of code that run when you mutate a field in an object. This is overhead relative to non-generational configurations, where the mutator doesn’t have to invoke collector code when it sets fields.
So, could it be that Whippet’s write barriers or remembered set are somehow so inefficient that my tests are unrepresentative of the state of the art?
I used to use card-marking barriers, but I started to suspect they cause too much overhead during minor GC and introduced too much cache contention. I switched to precise field-logging barriers some months back for Whippet’s Immix-derived space, and we use the same kind of barrier in the generational copying (pcc) collector. I think this is state of the art. I need to see if I can find a configuration that allows me to measure the overhead of these barriers, independently of other components of a generational collector.
is it something about the generational mechanism?
A few months ago, my only generational collector used the sticky mark-bit algorithm, which is an unconventional configuration: its nursery is not contiguous, non-moving, and can be as large as the heap. This is part of the reason that I implemented generational support for the parallel copying collector, to have a different and more conventional collector to compare against. But generational collection loses on some of these benchmarks in both places!
is it something about collecting more often?
On one benchmark which repeatedly constructs some trees and then verifies them, I was seeing terrible results for generational GC, which I realized were because of cooperative safepoints: generational GC collects more often, so it requires that all threads reach safepoints more often, and the non-allocating verification phase wasn’t emitting any safepoints. I had to change the compiler to emit safepoints at regular intervals (in my case, on function entry), and it sped up the generational collector by a significant amount.
This is one instance of a general observation, which is that any work that doesn’t depend on survivor size in a GC pause is more expensive with a generational collector, which runs more collections. Synchronization can be a cost. I had one bug in which tracing ephemerons did work proportional to the size of the whole heap, instead of the nursery; I had to specifically add generational support for the way Whippet deals with ephemerons during a collection to reduce this cost.
is it something about collection frequency?
Looking deeper at the data, I have partial answers for the splay benchmark, and they are annoying :)
Splay doesn’t actually allocate all that much garbage. At a 2.5x heap, the stock parallel MMC collector (in-place, sticky mark bit) collects... one time. That’s all. Same for the generational MMC collector, because the first collection is always major. So at 2.5x we would expect the generational collector to be slightly slower. The benchmark is simply not very good – or perhaps the most generous interpretation is that it represents tasks that allocate 40 MB or so of long-lived data and not much garbage on top.
Also at 2.5x heap, the whole-heap copying collector runs 9 times, and the generational copying collector does 293 minor collections and... 9 major collections. We are not reducing the number of major GCs. It means either the nursery is too small, so objects aren’t dying young when they could, or the benchmark itself doesn’t conform to the weak generational hypothesis.
At a 1.5x heap, the copying collector doesn’t have enough space to run. For MMC, the non-generational variant collects 7 times, and generational MMC times out. Timing out indicates a bug, I think. Annoying!
I tend to think that if I get results and there were fewer than, like, 5 major collections for a whole-heap collector, that indicates that the benchmark is probably inapplicable at that heap size, and I should somehow surface these anomalies in my analysis scripts.
collecting more often redux
Doing a similar exercise for nboyer at 2.5x heap with 8 threads (4GB for 1.6GB live data), I see that pcc did 20 major collections, whereas generational pcc lowered that to 8 major collections and 3471 minor collections. Could it be that there are still too many fixed costs associated with synchronizing for global stop-the-world minor collections? I am going to have to add some fine-grained tracing to find out.
conclusion?
I just don’t know! I want to believe that generational collection was an out-and-out win, but I haven’t yet been able to prove it is true.
I do have some homework to do. I need to find a way to test the overhead of my write barrier – probably using the MMC collector and making it only do major collections. I need to fix generational-mmc for splay and a 1.5x heap. And I need to do some fine-grained performance analysis for minor collections in large heaps.
Enough for today. Feedback / reactions very welcome. Thanks for reading and happy hacking!
Read the original article
Comments
By pizlonator 2025-02-0918:106 reply I think it’s the choice of benchmarks.
GenGC is an improvement if you have:
- High allocation rate. I think his benchmarks do have high allocation rate so this part is fine.
- Large heap. I think splay has a large heap so this part is fine.
- Lots of objects in that large heap that simply survive one GC after another, while the allocation rate is mostly due to objects that die immediately. This is the part that splay doesn’t have. Splay churns all of its large heap.
Empirically, really big software written in GC’d languages have all three of these qualities. They have heaps that are large enough for GenGC to be profitable. They allocate at a high enough rate. And most of the allocated objects die almost immediately, while most of the objects that survive GC survive for many GC cycles.
You need that kind of test for it to be worth it, and you would have such a test if you had big enough software to run.
By oorza 2025-02-0918:15 I remember back in the before times... when escape analysis debuted for the JVM - which allows it to scalar replace or stack allocate small enough short-lived objects that never escape local scope and therefore bypass GC altogether - our Spring servers spent something like 60% less time in garbage collection. Saying enterprise software allocates a ton of short lived objects is quite an understatement.
Another thing big programs have is a huge ramp-up phase where they construct the main guts of their massive heap. Splay, for example, benefits from have an enormous nursery in the beginning because for the startup phase the generational hypothesis doesn't really hold; most objects survive. So the first copy or couple of copies are a waste. V8 had at one time a "high promotion mode" that would kick in for such programs at the start, using various heuristics. In high promotion mode, entire pages are simply promoted en masse to the old gen, and nursery size gets quickly enlarged.
By kazinator 2025-02-1019:29 In these systems it might make sense to have the image start with GC disabled, and the application will turn it on past a certain point in its initialization, and do a full GC at that point to compact everything to the mature generation.
By fweimer 2025-02-0922:45 That's probably it. I found a weird Java version of the benchmark here:
https://github.com/newspeaklanguage/benchmarks/blob/master/S...
At least for some parameters, non-generational Shenandoah is faster than generational G1 (both overall run time and time spent in the benchmark phase, and overall CPU usage). But I expect it's possible to get wildly varying benchmark behavior depending on the parameter choices (the defaults are of course much too low).
By CyberDildonics 2025-02-1017:27 This is exactly why so much garbage collection optimization is apples and oranges. It is trying to mitigate the performance problems from things you shouldn't do in the first place if you care about speed.
Heap allocation, heap deallocation and the pointer chasing that comes along with the memory fragmentation are possibly the biggest killers of speed outside of scripting languages but java was designed in a way that it forces people into way of programming. As a result, enormous research has gone into trying to deal with something that could have been avoided completely.
By dan-robertson 2025-02-102:54 So maybe it would be interesting if allocations could be tracked better for the test? Maybe see the distribution of allocation life in terms of how many minor GCs are survived (perhaps you need to hack in some whole-heap liveness checking each time there’s a minor gc, for the purposes of the experiment). I think it would be nice to be able to rule out ‘most objects are promoted but have short lives’ as a cause.
By hinkley 2025-02-0918:23 One of the hallmarks of pure functional languages is that each “edit” of a data collection creates a new structure that refers back to part of the original. Which should be showcased well in a reasonable benchmark.
But I haven’t looked at Scheme in 32 years and I was angry about it then so I’m not going to start today.
So I will just agree that something is up.
His blog post is based upon the premise that his generational gc allocator doesn't seem to provide the performance benefits that generational gc is claimed to provide vs other more traditional gc approaches (e.g. mark and sweep- also his implementation).
My initial take is that either his implementations are deficient in some way (or not sufficiently modern), there's some underlying latent issue that arises from the Scheme to C compiler or the kind of C code it generates, or perhaps the benchmarks he is using are not indicative of real-world workloads.
But- I am out of my depth to analyze those things critically, and he seems to write about GC quite a bit, so maybe he's very in tune with the SOTA and he has uncovered an unexpected truth about generational gc.
It certainly wouldn't be the first time that an academic approach failed to deliver the benefits (or perhaps I should say the benefits weren't as great in as many scenarios as originally opined).
As an idiot programmer, my understanding is that Java, .NET & Go all have generational GC that is quite performant compared to older approaches, and that steady progress is made regularly across those ecosystems' gc (multiple gcs in the case of Java).
P.S. and now I see in a comment below (or maybe above now) that Go doesn't use a generational gc. I'm surprised.
By neonsunset 2025-02-0917:253 reply Go has somewhat "exotic" non-generational design optimized for latency. As a result it has poor throughput and performs quite badly outside the scenarios it was designed for.
But on moderate to light allocation traffic it is really nice. Just not very general-purpose.
Java has by far the most advanced GC implementations (it lives and dies by GC perf/efficiency after all) with .NET being a very close competitor.
By schmichael 2025-02-0917:503 reply Go optimizing for latency over throughput means the GC very rarely interferes with my applications SLO at the cost (literally $) of presumably requiring more total compute than a GC that allows more fine tuned tradeoffs between latency and throughput.
As someone who is not directly paying the bills but has wasted far too much of my life staring at JVM GC graphs and carefully tuning knobs, I vastly prefer Go’s opinionated approach. Obviously not a universally optimal choice but I’m so thankful it works for me! I don’t miss pouring over GC docs and blog posts for days trying to save my services P99 from long pauses.
You are comparing very old Java if you had to touch anything else than heap size.
Especially that Java's GCs are by far the very very best, everything else is significantly behind (partially because other platforms may not be as reliant on object allocation, but it depends on your usecase)
By neonsunset 2025-02-0918:50 .NET is not far behind at all. It is also better at heap size efficiency and plays nicely with interop. Plus the fact that the average allocation traffic is much lower in .NET applications on comparable code than in Java also helps.
By schmichael 2025-02-0918:361 reply This is absolutely true! I haven’t stared at a JVM GC graph is over 8 years.
I wonder how much of that is truly GC improvements vs. increased hardware speed dropping pause times.
By adgjlsfhk1 2025-02-0921:391 reply With traditional low latency GC designs (e.g. Shenandoah/G1), faster hardware provides almost no benefit because the GC pause is based around the time for core to core communication which hasn't decreased much (since we keep adding extra cores so the fight has to be to keep it from getting slower)
By naasking 2025-02-0923:28 The benchmarks don't necessarily use all of the cores though, and memory bandwidth has increased considerably since those original benchmarks, so you should expect pause times to decrease from that alone.
By hiddew 2025-02-0919:15 You can use GC defaults, but tuning can provide valuable throughput or latency improvements for the application if you tune the GC parameters according to the workload. Especially latency sensitive applications may benefit from generational ZGC in modern JVMs.
By neonsunset 2025-02-0918:062 reply > the GC very rarely interferes with my applications SLO
Somewhat random data point, but coraza-waf, a WAF component for e.g. Caddy, severely regresses on larger payloads and the GC scaling issues are a major contributor to this. In another data point, Twitch engineering back in the day had to do incredibly silly tricks like doing huge allocations at the application start to balloon the heap size and avoid severe allocation throttling. There is no free lunch!
Go's GC also does not scale with cores linearly at all, which both Java and .NET do quite happily, up to very high core counts (another platform that does it well - BEAM, thanks to per-process isolated GCs).
The way Java GCs require an upfront configuration is not necessarily the only option. .NET approach is quite similar to Go's - it tries to provide the best defaults out of box. It also tries to adapt to workload profile automatically as much as possible. The problem with Go here is that it offers no escape hatches whatsoever - you cannot tune heap sizes beyond just limits, memory watermark, collection aggressiveness and frequency, latency/throughput tradeoff and other knobs to fit your use case the best. It's either Go's way or the highway.
Philosophically, I think there's an issue where if you have a GC or another feature that is very misuse-resistant, this allows badly written code to survive until it truly bites you. This was certainly an issue that caused a lot of poorly written async code in .NET back in the day to not be fixed until the community went into "over-correction". So in both Java and C# spaces developers just expect the GC to deal with whatever they throw at it, which can be orders of magnitude more punishing than what Go's GC can work with.
By cyberax 2025-02-0921:14 It's not that Go doesn't provide escape hatches out of malice, it just doesn't really _have_ them. Its GC is very simplistic and non-generational, so pretty much all you can control is the frequency of collections.
The .NET GC is impressive in its ability to keep things running longer than they probably should.
In most cases with a slow memory leak I've been able to negotiate an interim solution where the process is bounced every day/week/month. Not ideal, but buys time and energy to rewrite using streams or spans or whatever.
The only thing that I don't like about the .NET GC is the threshold for the large object heap. Every time a byte array gets to about 10k long, a little voice in my head starts to yell. The #1 place this comes up for me is deserialization of large JSON documents. I've been preferring actual SQL columns over JSON blobs to avoid hitting LOH. I also keep my ordinary blobs in their own table so that populating a row instance will not incur a large allocation by default.
How much of the .NET GC's performance is attributable to hard coding the threshold at 85k? If we made this configurable in the csproj file, would we suffer a severe penalty?
By neonsunset 2025-02-0921:40 > I've been preferring actual SQL columns over JSON blobs to avoid hitting LOH. I also keep my ordinary blobs in their own table so that populating a row instance will not incur a large allocation by default.
Are you using Newtonsoft.Json? I found System.Text.Json to be very well-behaved in terms of GC (assuming you are not allocating a >85K string). Also 10k element byte array is just ~10KB still. If you are taking data in larger chunks, you may want to use array pool. Regardless, even if you are hitting LOH, it should not pose much issues under Server GC. The only way to cause problems is if there's something which permanently roots objects in Gen2 or LOH in a way that, beyond leaking, causes high heap fragmentation, forcing non-concurrent Gen2/LOH collections under high memory pressure, which .NET really tries to avoid but sometimes has no choice but doing.
> How much of the .NET GC's performance is attributable to hard coding the threshold at 85k? If we made this configurable in the csproj file, would we suffer a severe penalty?
You could try it and see, it should not be a problem unless the number is unreasonable. It's important to consider whether large objects will indeed die in Gen0/1 and not just be copied around generations unnecessarily. Alternate solutions include segmented lists/arrays, pooling, or using more efficient data structures. LOH allocations themselves are never a source of the leak and if there is a bug in implementation, it must be fixed instead. It's quite easy to get a dump with 'dotnet-dump' and then feeding it into Visual Studio, dotMemory or plain 'dotnet-dump' analyze.
Other way of putting it is that Golang optimizes for latency over throughput because it would suck at latency if it only optimized for throughput. That can only be called a sensible choice.
Weak point of Golang though is its terrible interop with C and all C-compatible languages. Means you can't optimize parts of a Golang app to dispense with GC altogether, unless using a totally separate toolchain w/ "CGo".
> unless using a totally separate toolchain w/ "CGo".
CGo is built into the primary Go toolchain... it's not a 'totally separate toolchain' at all, unless you're referring to the C compiler used by CGo for the C code... but that's true of every language that isn't C or C++ when it is asked to import and compile some C code. You could also write assembly functions without CGo, and that avoids invoking a C compiler.
> Means you can't optimize parts of a Golang app to dispense with GC altogether
This is also not true... by default, Go stack allocates everything. Things are only moved to the heap when the compiler is unable to prove that they won't escape the current stack context. You can write Go code that doesn't heap allocate at all, and therefore will create no garbage at all. You can pass a flag to the compiler, and it will emit its escape analysis. This is one way you can see whether the code in a function is heap allocating, and if it is, you can figure out why and solve that. 99.99% of the time, no one cares, and it just works. But if you need to "dispense with GC altogether", it is possible.
You can also disable the GC entirely if you want, or just pause it for a critical section. But again... why? When would you need to do this?
Go apps typically don't have much GC pressure in my experience because short-lived values are usually stack allocated by the compiler.
By neonsunset 2025-02-0918:521 reply > You can write Go code that doesn't heap allocate at all
In practice this proves to be problematic because there is no guarantee whether escape analysis will in fact do what you want (as in, you can't force it, and you don't control dependencies unless you want to vendor). It is pretty good, but it's very far from being bullet-proof. As a result, Go applications have to resort to sync.Pool.
Go is good at keeping allocation profile at bay, but I found it unable to compete with C# at writing true allocation-free code.
As I mentioned in my comment, you can also observe the escape analysis from the compiler and know whether your code will allocate or not, and you can make adjustments to the code based on the escape analysis. I was making the point that you technically can write allocation-free code, it is just extremely rare for it to matter.
sync.Pool is useful, but it solves a larger class of problems. If you are expected to deal with dynamically sized chunks of work, then you will want to allocate somewhere. sync.Pool gives you a place to reuse those allocations. C# ref structs don't seem to help here, since you can't have a dynamically sized ref struct, AFAIK. So, if you have a piece of code that can operate on N items, and if you need to allocate 2*N bytes of memory as a working set, then you won't be able to avoid allocating somewhere. That's what sync.Pool is for.
Oftentimes, sync.Pool is easier to reach for than restructuring code to be allocation-free, but sync.Pool isn't the only option.
By neonsunset 2025-02-0922:031 reply > sync.Pool is useful, but it solves a larger class of problems. If you are expected to deal with dynamically sized chunks of work, then you will want to allocate somewhere. sync.Pool gives you a place to reuse those allocations. C# ref structs don't seem to help here, since you can't have a dynamically sized ref struct, AFAIK. So, if you have a piece of code that can operate on N items, and if you need to allocate 2*N bytes of memory as a working set, then you won't be able to avoid allocating somewhere. That's what sync.Pool is for.
Ref structs (which really are just structs that can hold 'ref T' pointers) are only one feature of the type system among many which put C# in the same performance weight class as C/C++/Rust/Zig. And they do help. Unless significant changes happen to Go, it will remain disadvantaged against C# in writing this kind of code.
C# is not in the same realm as C/C++/Rust. Sorry. It is in a distinctly separate and non-overlapping box: https://benchmarksgame-team.pages.debian.net/benchmarksgame/...
Only the whiskers are touching, and the same applies to several other languages too. Yes, the median is impressively low… for anything other than those three. And it is still separate.
C# has impressive performance, but it is categorically separate from those three languages, and it is disingenuous to claim otherwise without some extremely strong evidence to support that claim.
My interpretation is supported not just by the Benchmarks Game, but by all evidence I’ve ever seen up to this point, and I have never once seen anyone make claim that about C# until now… because C# just isn’t in the same league.
> Ref structs (which really are just structs that can hold 'ref T' pointers)
No…? https://learn.microsoft.com/en-us/dotnet/csharp/language-ref...
A ref struct can hold a lot more than that. The uniquely defining characteristic of a ref struct is that the compiler guarantees it will not leave the stack, ever. A ref struct can contain a wide variety of different values, not just ref T, but yes, it can also contain other ref T fields.
> just isn’t in the same league
I wonder what would be needed to even accept that programs were comparable?
https://benchmarksgame-team.pages.debian.net/benchmarksgame/...
(Incidentally, at-present the measurements summarized on the box plots are C# jit not C# naot.)
I’m saying C# as a whole, not C# on one example. But, I have already agreed that C#’s performance has become pretty impressive. I also still believe that idiomatic Rust is going to be faster than idiomatic C#, even if C# now supports really advanced (and non-idiomatic) patterns that let you rewrite chunks of code to be much faster when needed.
It would be interesting to see the box plot updated to include the naot results — I had assumed that it was already.
The benchmarks game's half-dozen tiny tiny examples have nothing to say about "C# as a whole".
They have more to say than a single cherry picked benchmark from the half dozen.
I had asked the other person for additional benchmarks that supported their cause. They refused to point at a single shred of evidence. I agree the Benchmarks Game isn’t definitive. But it is substantially more useful than people making completely unsupported claims.
I find most discussions of programming language performance to be pointless, but some discussions are even more pointless than others.
By igouy 2025-02-1019:57 I curate the benchmarks game, so to me it's very much an initial step, a starting point. It's a pity that those next steps always seem like too much effort.
By neonsunset 2025-02-0922:261 reply This is a distribution of submissions. I suggest you look at the actual implementations and how they stack-up performance wise and what kind of patterns each respective language enables. You will quickly find out that this statement is incorrect and they behave rather closely on optimized code. Another good exercise will be to actually use a disassembler for once and see how it goes with writing performant algorithm implementation. It will be apparent that C# for all intents and purposes must be approached quite similarly with practically identical techniques and data structures as the systems programming family of languages and will produce a comparable performance profile.
> No…? https://learn.microsoft.com/en-us/dotnet/csharp/language-ref... A ref struct can hold a lot more than that. What’s unique about a ref struct is that the compiler guarantees it will not leave the stack, ever. A ref struct can contain all sorts of different stack-allocatable values, not just references.
Do you realize this is not a mutually exclusive statement? Ref structs are just structs which can hold byref pointers aka managed references. This means that, yes, because managed references can only ever be placed on the stack (but not the memory they point to), a similar restriction is placed on ref structs alongside the Rust-like lifetime analysis to enforce memory safety. Beyond this, their semantics are identical to regular structs.
I.e.
> C# ref structs don't seem to help here, since you can't have a dynamically sized ref struct, AFAIK
Your previous reply indicates you did not know the details until reading the documentation just now. This is highly commendable because reading documentation as a skill seems to be in short supply nowadays. However, it misses the point that memory (including dynamic, whatever you mean by this, I presume reallocations?) can originate from anywhere - stackalloc buffers, malloc, inline arrays, regular arrays or virtually any source of memory, which can be wrapped into Span<T>'s or addressed with unsafe byref arithmetics (or pinning and using raw pointers).
Ref structs help with this a lot and enable many data structures which reference arbitrary memory in a generalized way (think writing a tokenizer that wraps a span of chars, much like you would do in C but retaining GC compatibility without the overhead of carrying the full string like in Go).
You can also trivially author fully identical Rust-like e.g. Vec<T>[0] with any memory source, even on top of Jemalloc or Mimalloc (which has excellent pure C# reimplementation[1] fully competitive with the original implementation in C).
None of this is even remotely possible in any other GC-based language.
[0]: https://github.com/neon-sunset/project-anvil/blob/master/Sou... (pluggable allocators ala Zig, generics are fully monomorphized here, performance is about on par with Rust)
[1]: https://github.com/terrafx/terrafx.interop.mimalloc (disclaimer: outdated description, it used to be just a bindings library, just open the src folder to verify it's no longer the case)
People have had a long time to submit better C# implementations. You are still providing no meaningful evidence.
> Do you realize this is not a mutually exclusive statement?
It doesn’t have to be mutually exclusive. You didn’t seem to understand why people care about ref structs, since you chose to focus on something that is an incidental property, not the reason that ref structs exist.
Brigading you is not my intent, so please don't take my comments that way.
I just want to add that C# is getting pretty fast, and it's not just because people have had a long time to submit better implementations to a benchmark site.
The language began laying the groundwork for AOT and higher performance in general with the introduction of Span<T> and friends 7 or so years ago. Since then, they have been making strides on a host of fronts to allow programmers the freedom to express most patterns expected of a low level language, including arbitrary int pointers, pointer arithmetic, typed memory regions, and an unsafe subset.
In my day-to-day experience, C# is not as fast as the "big 3" non-GCed languages (C/C++/Rust), especially in traditional application code that might use LINQ, code generation or reflection (which are AOT unfriendly features- i.e. AOT LINQ is interpreted at runtime), but since I don't tend to re-write the same code across multiple languages simultaneously I can't quantify the extent of the current speed differences.
I can say, however, that C# has been moving forward every release, and those benchmarks demonstrate that it is separating itself from the Java/Go tier (and I consider Go to be a notch or two above JITed Java, but no personal experience with GraalVM AOT yet) and it definitely feels close to the C/C++/Rust tier.
It may not ever attain even partial parity on that front, for a whole host of reasons (its reliance on its own compiler infrastructure and not a gcc or llvm based backend is a big one for me), but the language itself has slowly implemented the necessary constructs for safe (and unsafe) arbitrary memory manipulation, including explicit stack & heap allocation, and the skipping of GC, which are sort of the fundamental "costs of admission" for consideration as a high performance systems language.
I don't expect anyone to like or prefer C#, nor do I advocate forcing the language on anyone, and I really hate being such a staunch advocate here on HN (I want to avoid broken record syndrome), but as I have stated many times here, I am a big proponent of programmer ergonomics, and C# really seems to be firing on all cylinders right now (recent core library CVEs notwithstanding).
> C# really seems to be firing on all cylinders right now
I actually agree completely: https://news.ycombinator.com/item?id=42898372
I just don’t like seeing people make bold claims without supporting evidence… those tend to feel self-aggrandizing and/or like tribalism. It also felt like a bad faith argument, so I stopped responding to that other person when there was nothing positive I could say. If the evidence existed, then they should have provided evidence. I asked for evidence.
I like C#, just as I like Go and Rust. But languages are tools, and I try to evaluate tools objectively.
> I can say, however, that C# has been moving forward every release, and those benchmarks demonstrate that it is separating itself from the Java/Go tier
I also agree. I have been following the development of C# for a very long time. I like what I have seen, especially since .NET Core. As I have mentioned in this thread already, C#’s performance is impressive. I just don’t accept a general claim that it’s as fast as Rust at this point, but not every application needs that much performance. I wish I could get some real world experience with C#, I just haven’t found any interesting tech jobs that use C#… and the job market right now doesn’t seem great, unfortunately.
By caspper69 2025-02-1010:00 I have hopes that adoption outside of stodgy enterprises will pick up, which would of course help the job situation (in due time of course).
Sometimes it's hard to shake the rep you have when you're now a ~25 year old language.
Awareness takes time. People need to be told, then they need to tinker here and there. Either they like what they see when they kick the tires or they don't.
I'm pretty language agnostic tbh, but I would like to see it become a bit more fashionable given its modernization efforts, cross-platform support, and MIT license.
By neonsunset 2025-02-0922:35 Please read through the description and follow-up articles on the BenchmarksGame website. People did submit benchmarks, but submitting yet another SIMD+unsafe+full parallelization implementation is not the main goal of the project. However, this is precisely the subject (at which Go is inadequate) that we are discussing here. And for it, my suggestions in the previous comment stand.
By cyberax 2025-02-0921:10 There are some discussions to add optional generational regions to Go: https://github.com/golang/go/discussions/70257
By caspper69 2025-02-0917:27 Your comment posted as I was making my edit re: Go.
Thank you for the detailed clarification.
By whitehexagon 2025-02-0919:06 I spent quite some years performance tuning large Java systems, pre-warming server JVMs and then many hours staring at visualgc, a small Sun engineers tool for watching the various memory pools including generational GC, it was very satisfying work, and also pretty useful for uncovering bugs and race conditions when the systems were under load.
The GC advances that came along helped a lot, especially over the stop-the-world early days of Java GC, along with all the JVM tuning parameters that were gradually exposed for tweaking. But visualgc allowed for a real feel for how the generational GC was running just by watching the saw-tooth shaped graphs. Interestingly most of the garbage was string copying, especially with one companies system that had more abstractions than a Spring Oak has leaves, say no more least I have nightmares.
By citrin_ru 2025-02-1212:43 Go creates less garbage (more allocated on stack) so generational GC is less essential.
My understanding is that splay is more of a benchmark that you try to make generational GC not hurt too much. It allocates lots of long-lived objects that it holds onto for the full test, and for JS at least it then hangs strings off of those objects. It's pretty easy to make a generational GC just add an extra copy for no benefit with splay.
In SpiderMonkey, we had to add pretenuring in order to avoid slowing down splay too much. As in, identify specific allocation sites that create long-lived allocations, and allocate them directly from the older generation instead of having them go through the nursery. It's sort of selectively disabling generational GC on an allocation site granularity. (Also, make sure you're not storing nursery strings inside of tenured objects. While it's possible they'll be quickly overwritten by different strings, it's much more likely that they're going to last as long as the object does.)
Within Octane, the RegExp subtest had the biggest gain from allocating strings in the nursery. (But that's going from generational objects -> generational objects and strings. Non-generational objects -> generational objects might show up more on something else.)
Wouldn't be very difficult to know a priori whether the object allocated at a callsite is likely to be long-lived? The object has to be allocated before you can make some other object reference it. So when you do, even if you know that the reference is from an old-gen object "the mistake has already been made" and the new object has been allocated in the nursery.
I think the idea is you can then adjust future allocations from the same callsite, assuming that object lifetime is fairly well correlated with allocating callsite.
By sfink 2025-02-1017:59 Exactly. During minor GC, you update the promotion rate of each callsite. If it gets too high, you start allocating things from that callsite directly from the tenured heap, since your statistics are telling you that the things allocated at that callsite are usually going to end up living long enough that you're just wasting time scanning and copying them from the nursery to the tenured heap.
And yes, it assumes that lifetime is correlated pretty well with allocating callsite. Also that the correlation persists over time. The latter part often doesn't hold, so it's helpful to have a mechanism for changing the decision if you're finding a lot of dead stuff in the tenured heap that came from a pretenured callsite. But it's a delicate tradeoff: tracking the allocation sites costs time and memory, and so you might only want to do that for nursery allocations, but then you don't have a way to associate dead tenured objects with their allocation sites in case you need to stop pretenuring... lots of possibilities in the design space.
