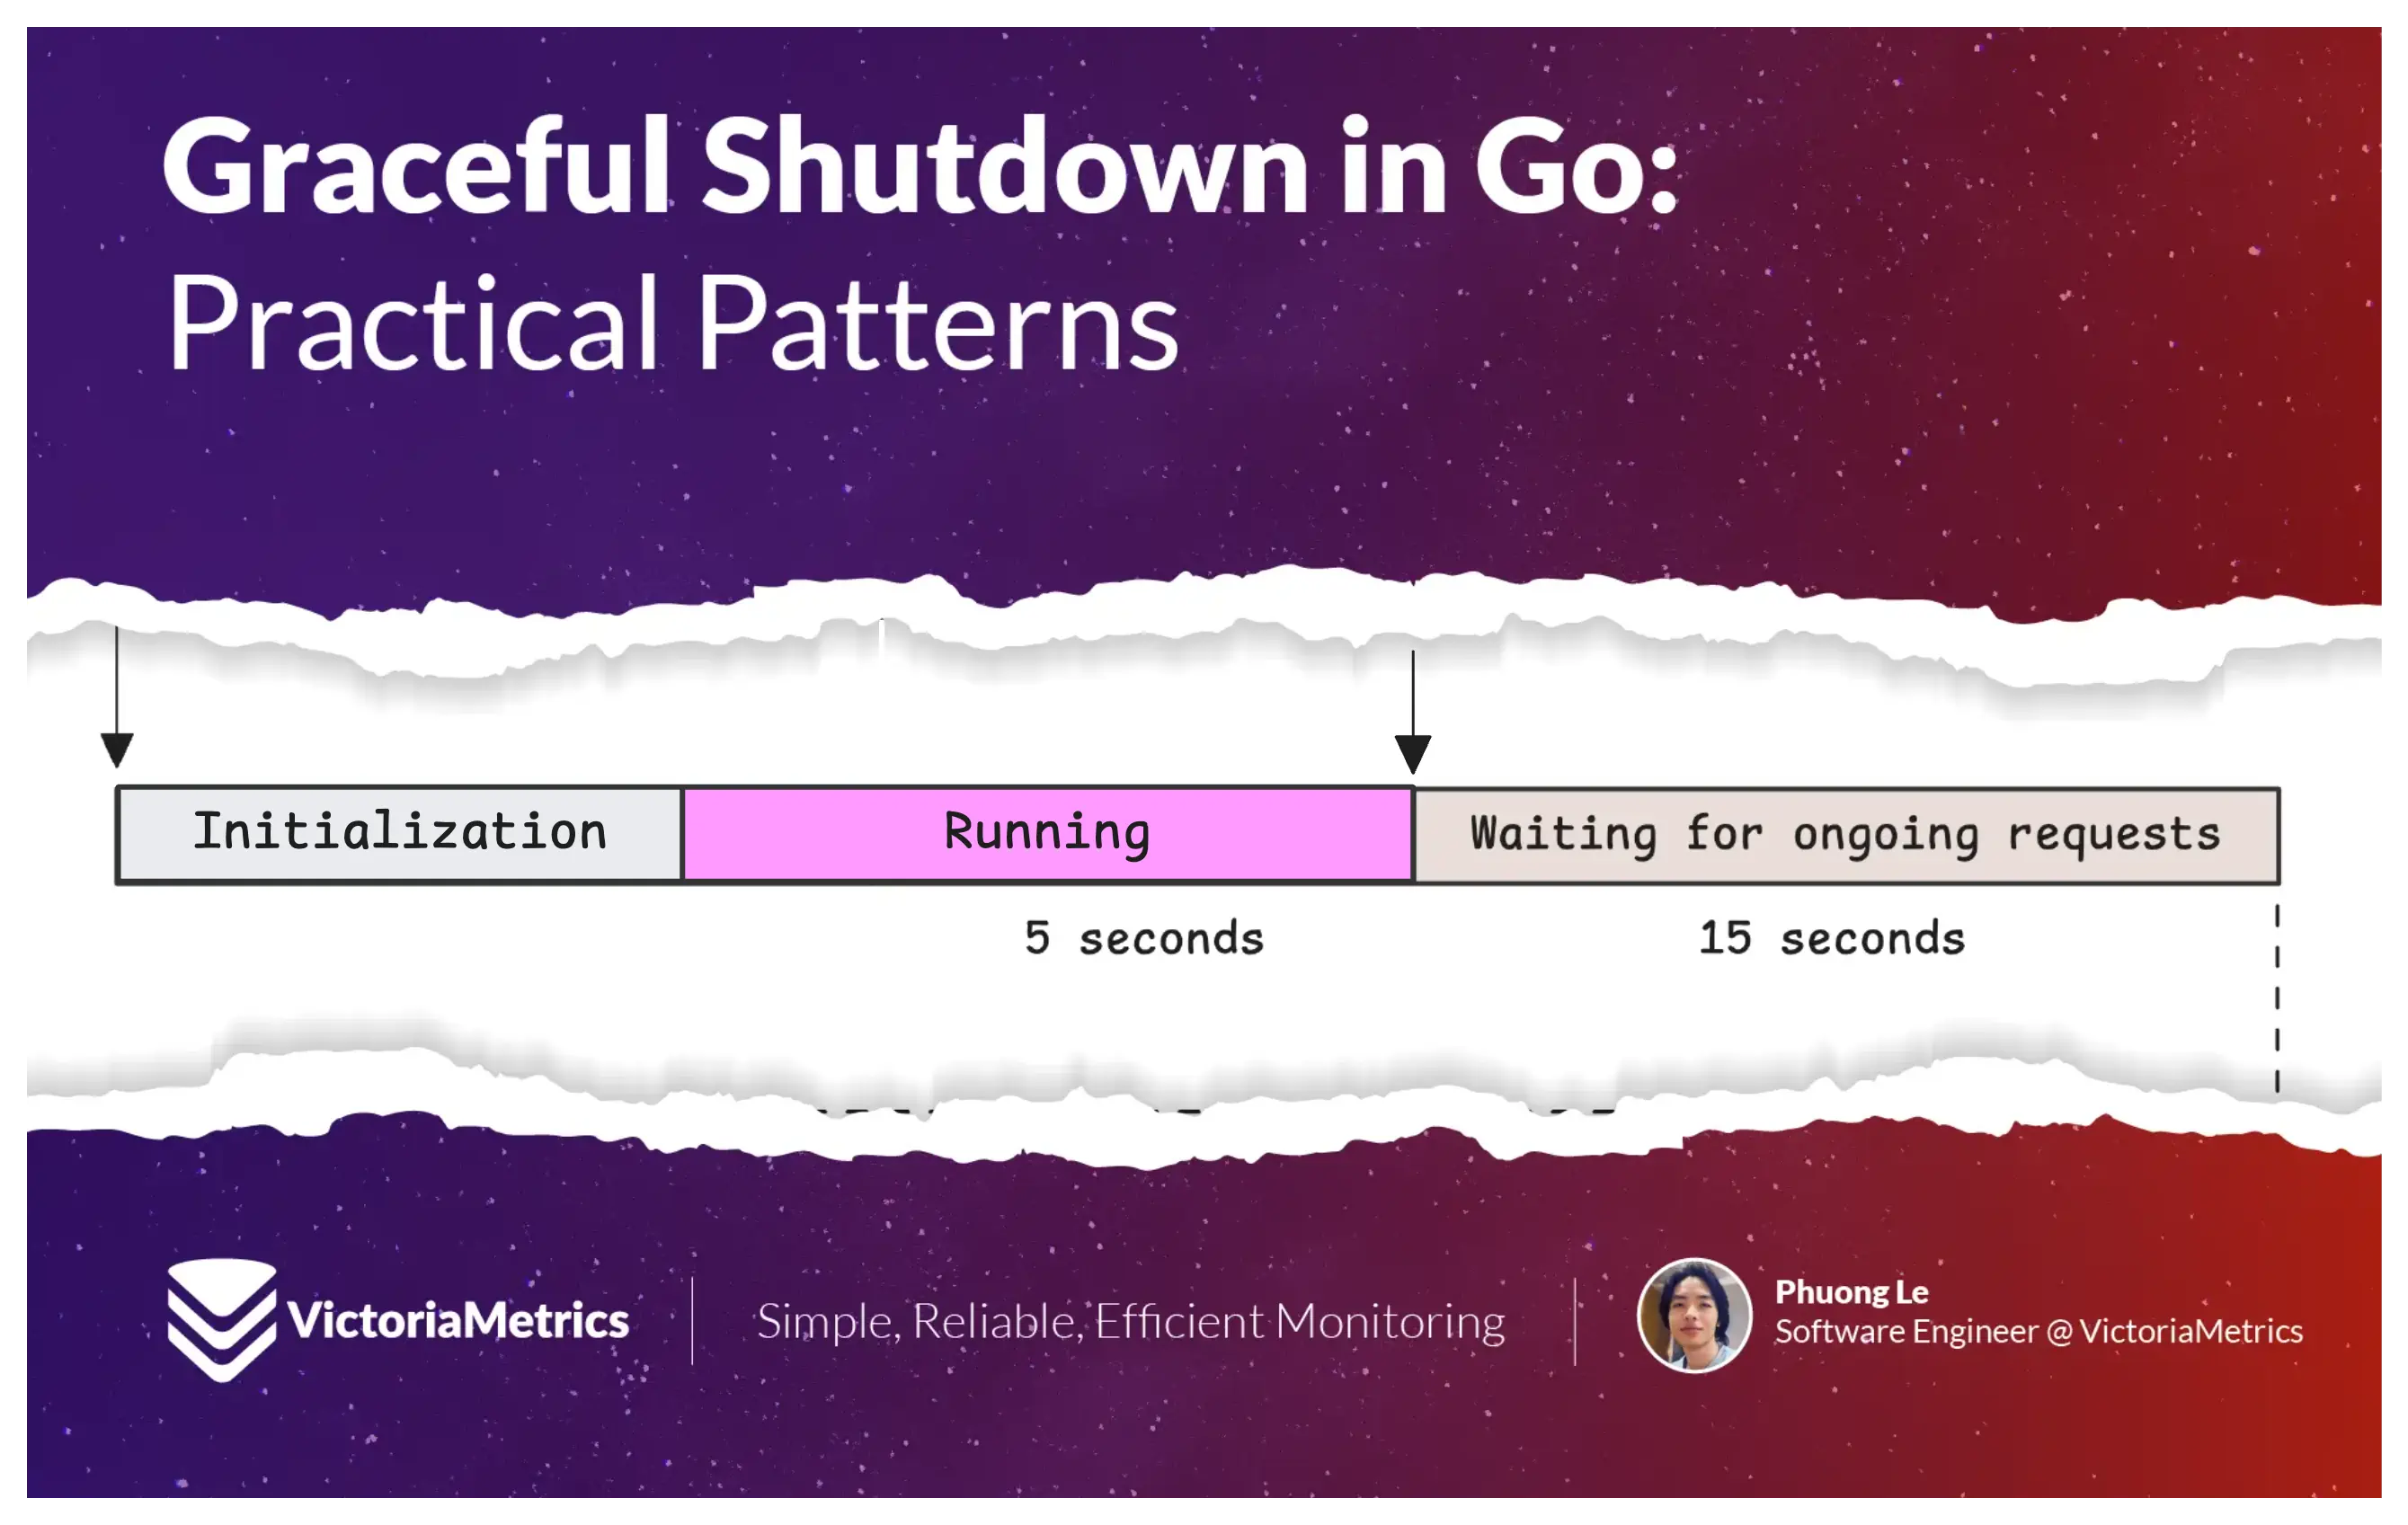
Go applications can implement graceful shutdown by handling termination signals (SIGTERM, SIGINT) via os/signal or signal.NotifyContext. Shutdown must complete within a specified timeout (e.g.,…

Graceful shutdown in any application generally satisfies three minimum conditions:
- Close the entry point by stopping new requests or messages from sources like HTTP, pub/sub systems, etc. However, keep outgoing connections to third-party services like databases or caches active.
- Wait for all ongoing requests to finish. If a request takes too long, respond with a graceful error.
- Release critical resources such as database connections, file locks, or network listeners. Do any final cleanup.
This article focuses on HTTP servers and containerized applications, but the core ideas apply to all types of applications.
Before we handle graceful shutdown, we first need to catch termination signals. These signals tell our application it’s time to exit and begin the shutdown process.
So, what are signals?
In Unix-like systems, signals are software interrupts. They notify a process that something has happened and it should take action. When a signal is sent, the operating system interrupts the normal flow of the process to deliver the notification.
Here are a few possible behaviors:
- Signal handler: A process can register a handler (a function) for a specific signal. This function runs when that signal is received.
- Default action: If no handler is registered, the process follows the default behavior for that signal. This might mean terminating, stopping, continuing, or ignoring the process.
- Unblockable signals: Some signals, like
SIGKILL(signal number 9), cannot be caught or ignored. They may terminate the process.
When your Go application starts, even before your main function runs, the Go runtime automatically registers signal handlers for many signals (SIGTERM, SIGQUIT, SIGILL, SIGTRAP, and others). However, for graceful shutdown, only three termination signals are typically important:
SIGTERM(Termination): A standard and polite way to ask a process to terminate. It does not force the process to stop. Kubernetes sends this signal when it wants your application to exit before it forcibly kills it.SIGINT(Interrupt): Sent when the user wants to stop a process from the terminal, usually by pressingCtrl+C.SIGHUP(Hang up): Originally used when a terminal disconnected. Now, it is often repurposed to signal an application to reload its configuration.
People mostly care about SIGTERM and SIGINT. SIGHUP is less used today for shutdown and more for reloading configs. You can find more about this in SIGHUP Signal for Configuration Reloads.
By default, when your application receives a SIGTERM, SIGINT, or SIGHUP, the Go runtime will terminate the application.
When your Go app gets a SIGTERM, the runtime first catches it using a built-in handler. It checks if a custom handler is registered. If not, the runtime disables its own handler temporarily, and sends the same signal (SIGTERM) to the application again. This time, the OS handles it using the default behavior, which is to terminate the process.
You can override this by registering your own signal handler using the os/signal package.
func main() {
 signalChan := make(chan os.Signal, 1)
 signal.Notify(signalChan, syscall.SIGINT, syscall.SIGTERM)

 // Setup work here

 <-signalChan

 fmt.Println("Received termination signal, shutting down...")
}

signal.Notify tells the Go runtime to deliver specified signals to a channel instead of using the default behavior. This allows you to handle them manually and prevents the application from terminating automatically.
A buffered channel with a capacity of 1 is a good choice for reliable signal handling. Internally, Go sends signals to this channel using a select statement with a default case:
select {
case c <- sig:
default:
}
This is different from the usual select used with receiving channels. When used for sending:
- If the buffer has space, the signal is sent and the code continues.
- If the buffer is full, the signal is discarded, and the
defaultcase runs. If you’re using an unbuffered channel and no goroutine is actively receiving, the signal will be missed.
Even though it can only hold one signal, this buffered channel helps avoid missing that first signal while your app is still initializing and not yet listening.
You can call Notify multiple times for the same signal. Go will send that signal to all registered channels.
When you press Ctrl+C more than once, it doesn’t automatically kill the app. The first Ctrl+C sends a SIGINT to the foreground process. Pressing it again usually sends another SIGINT, not SIGKILL. Most terminals, like bash or other Linux shells, do not escalate the signal automatically. If you want to force a stop, you must send SIGKILL manually using kill -9.
This is not ideal for local development, where you may want the second Ctrl+C to terminate the app forcefully. You can stop the app from listening to further signals by using signal.Stop right after the first signal is received:
func main() {
 signalChan := make(chan os.Signal, 1)
 signal.Notify(signalChan, syscall.SIGINT)

 <-signalChan

 signal.Stop(signalChan)
 select {}
}
Starting with Go 1.16, you can simplify signal handling by using signal.NotifyContext, which ties signal handling to context cancellation:
ctx, stop := signal.NotifyContext(context.Background(), syscall.SIGINT, syscall.SIGTERM)
defer stop()

// Setup tasks here

<-ctx.Done()
stop()
You should still call stop() after ctx.Done() to allow a second Ctrl+C to forcefully terminate the application.
It is important to know how long your application has to shut down after receiving a termination signal. For example, in Kubernetes, the default grace period is 30 seconds, unless otherwise specified using the terminationGracePeriodSeconds field. After this period, Kubernetes sends a SIGKILL to forcefully stop the application. This signal cannot be caught or handled.
Your shutdown logic must complete within this time, including processing any remaining requests and releasing resources.
Assume the default is 30 seconds. It is a good practice to reserve about 20 percent of the time as a safety margin to avoid being killed before cleanup finishes. This means aiming to finish everything within 25 seconds to avoid data loss or inconsistency.
When using net/http, you can handle graceful shutdown by calling the http.Server.Shutdown method. This method stops the server from accepting new connections and waits for all active requests to complete before shutting down idle connections.
Here is how it behaves:
- If a request is already in progress on an existing connection, the server will allow it to complete. After that, the connection is marked as idle and is closed.
- If a client tries to make a new connection during shutdown, it will fail because the server’s listeners are already closed. This typically results in a “connection refused” error.
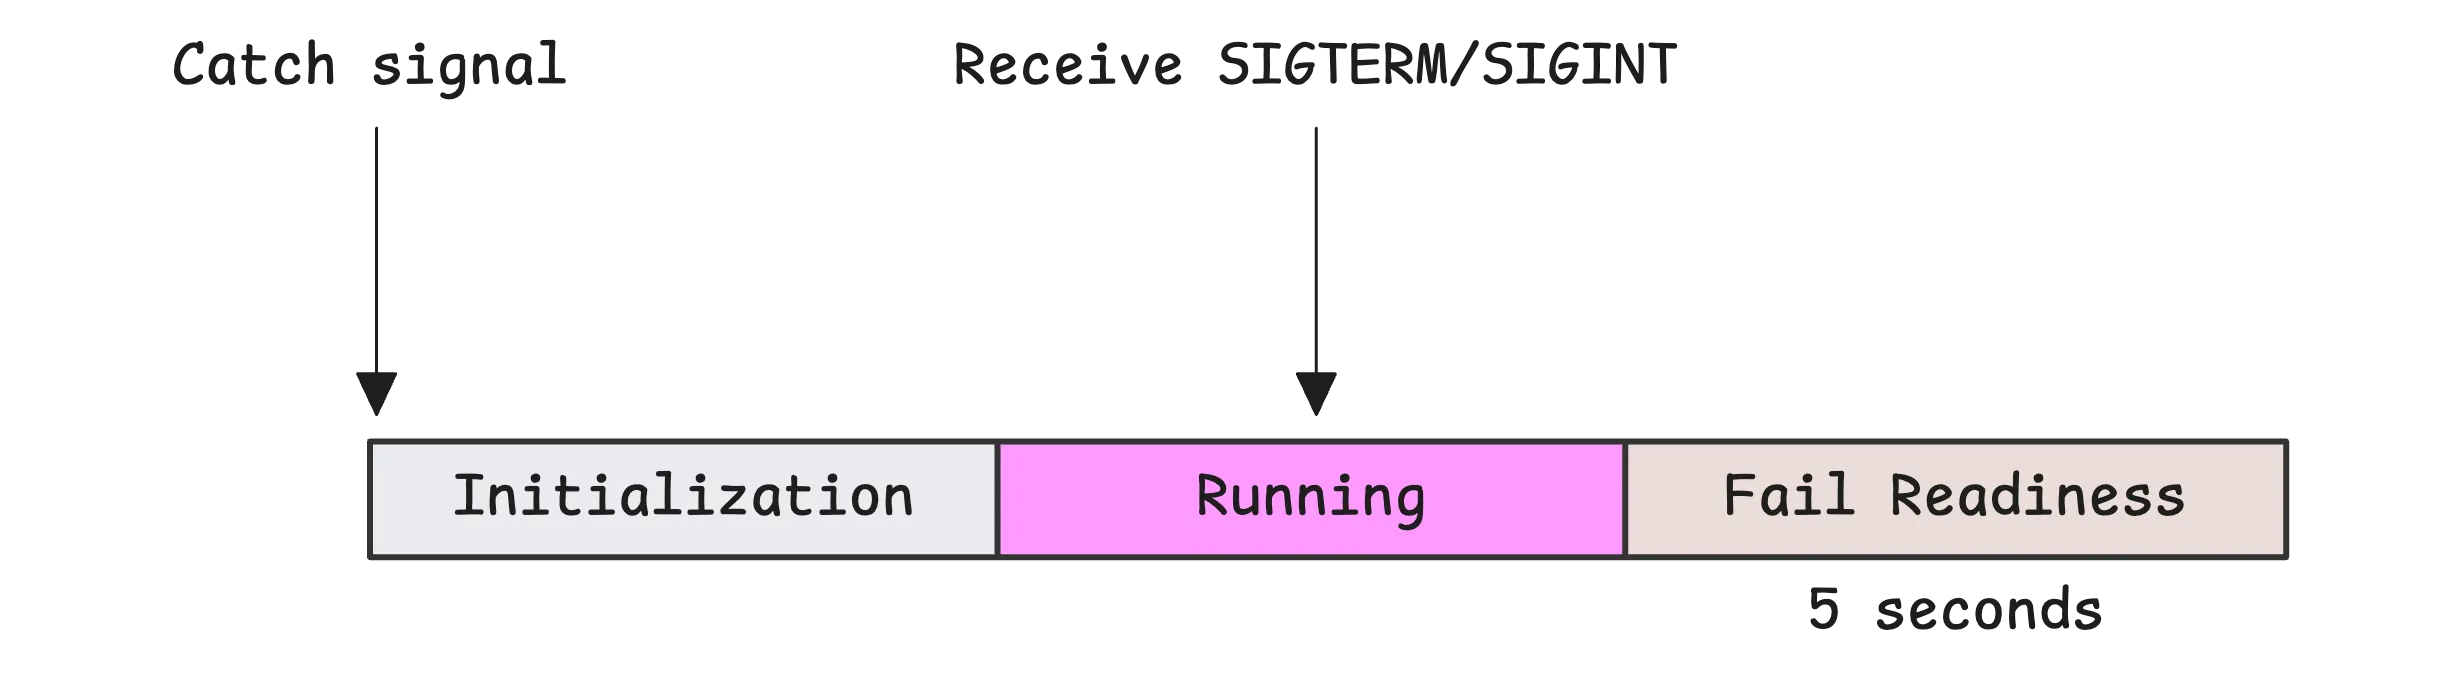
In a containerized environment (and many other orchestrated environments with load balancers), do not stop accepting new requests immediately. Even after a pod is marked for termination, it might still receive traffic for a few moments because the system needs time to update the service and load balancer.
This is especially true when using a readiness probe in Kubernetes, as a terminating pod can still receive traffic if no other endpoints are ready.
A readiness probe determines when a container is prepared to accept traffic by periodically checking its health through configured methods like HTTP requests, TCP connections, or command executions. If the probe fails, Kubernetes removes the pod from the service’s endpoints, preventing it from receiving traffic until it becomes ready again.
To avoid connection errors during this short window, the correct strategy is to fail the readiness probe first. This tells the orchestrator that your pod should no longer receive traffic:
var isShuttingDown atomic.Bool

func readinessHandler(w http.ResponseWriter, r *http.Request) {
 if isShuttingDown.Load() {
 w.WriteHeader(http.StatusServiceUnavailable)
 w.Write([]byte("shutting down"))
 return
 }

 w.WriteHeader(http.StatusOK)
 w.Write([]byte("ok"))
}
This pattern is also used as a code example in the test images. In their implementation, a closed channel is used to signal the readiness probe to return HTTP 503 when the application is preparing to shut down.
After updating the readiness probe to indicate the pod is no longer ready, wait a few seconds to give the system time to stop sending new requests.
The exact wait time depends on your readiness probe configuration; we will use 5 seconds for this article with the following simple configuration:
readinessProbe:
 httpGet:
 path: /healthz
 port: 8080
 periodSeconds: 5
This guide only gives you the idea behind graceful shutdown. Planning your graceful shutdown strategy depends on your application’s characteristics.
“Isn’t it better to still use terminating pod as a fallback if there are no other pods?”
There are 2 situations to consider:
- During normal operation, when a pod is marked for termination, there’s typically another pod that’s already running and handling traffic.
- During rolling updates, Kubernetes creates a new pod first and waits until it’s ready before sending SIGTERM to the pod being replaced.
However, if the other pod suddenly breaks while a pod is terminating, the terminating pod will still receive traffic as a fallback mechanism. This raises a question: should we avoid failing the readiness probe during termination to ensure this fallback works?
The answer is most likely no. If we don’t fail the readiness probe, we might face worse consequences if the terminating pod is abruptly killed with SIGKILL. This could lead to corrupted processes or data and cause more serious issues.
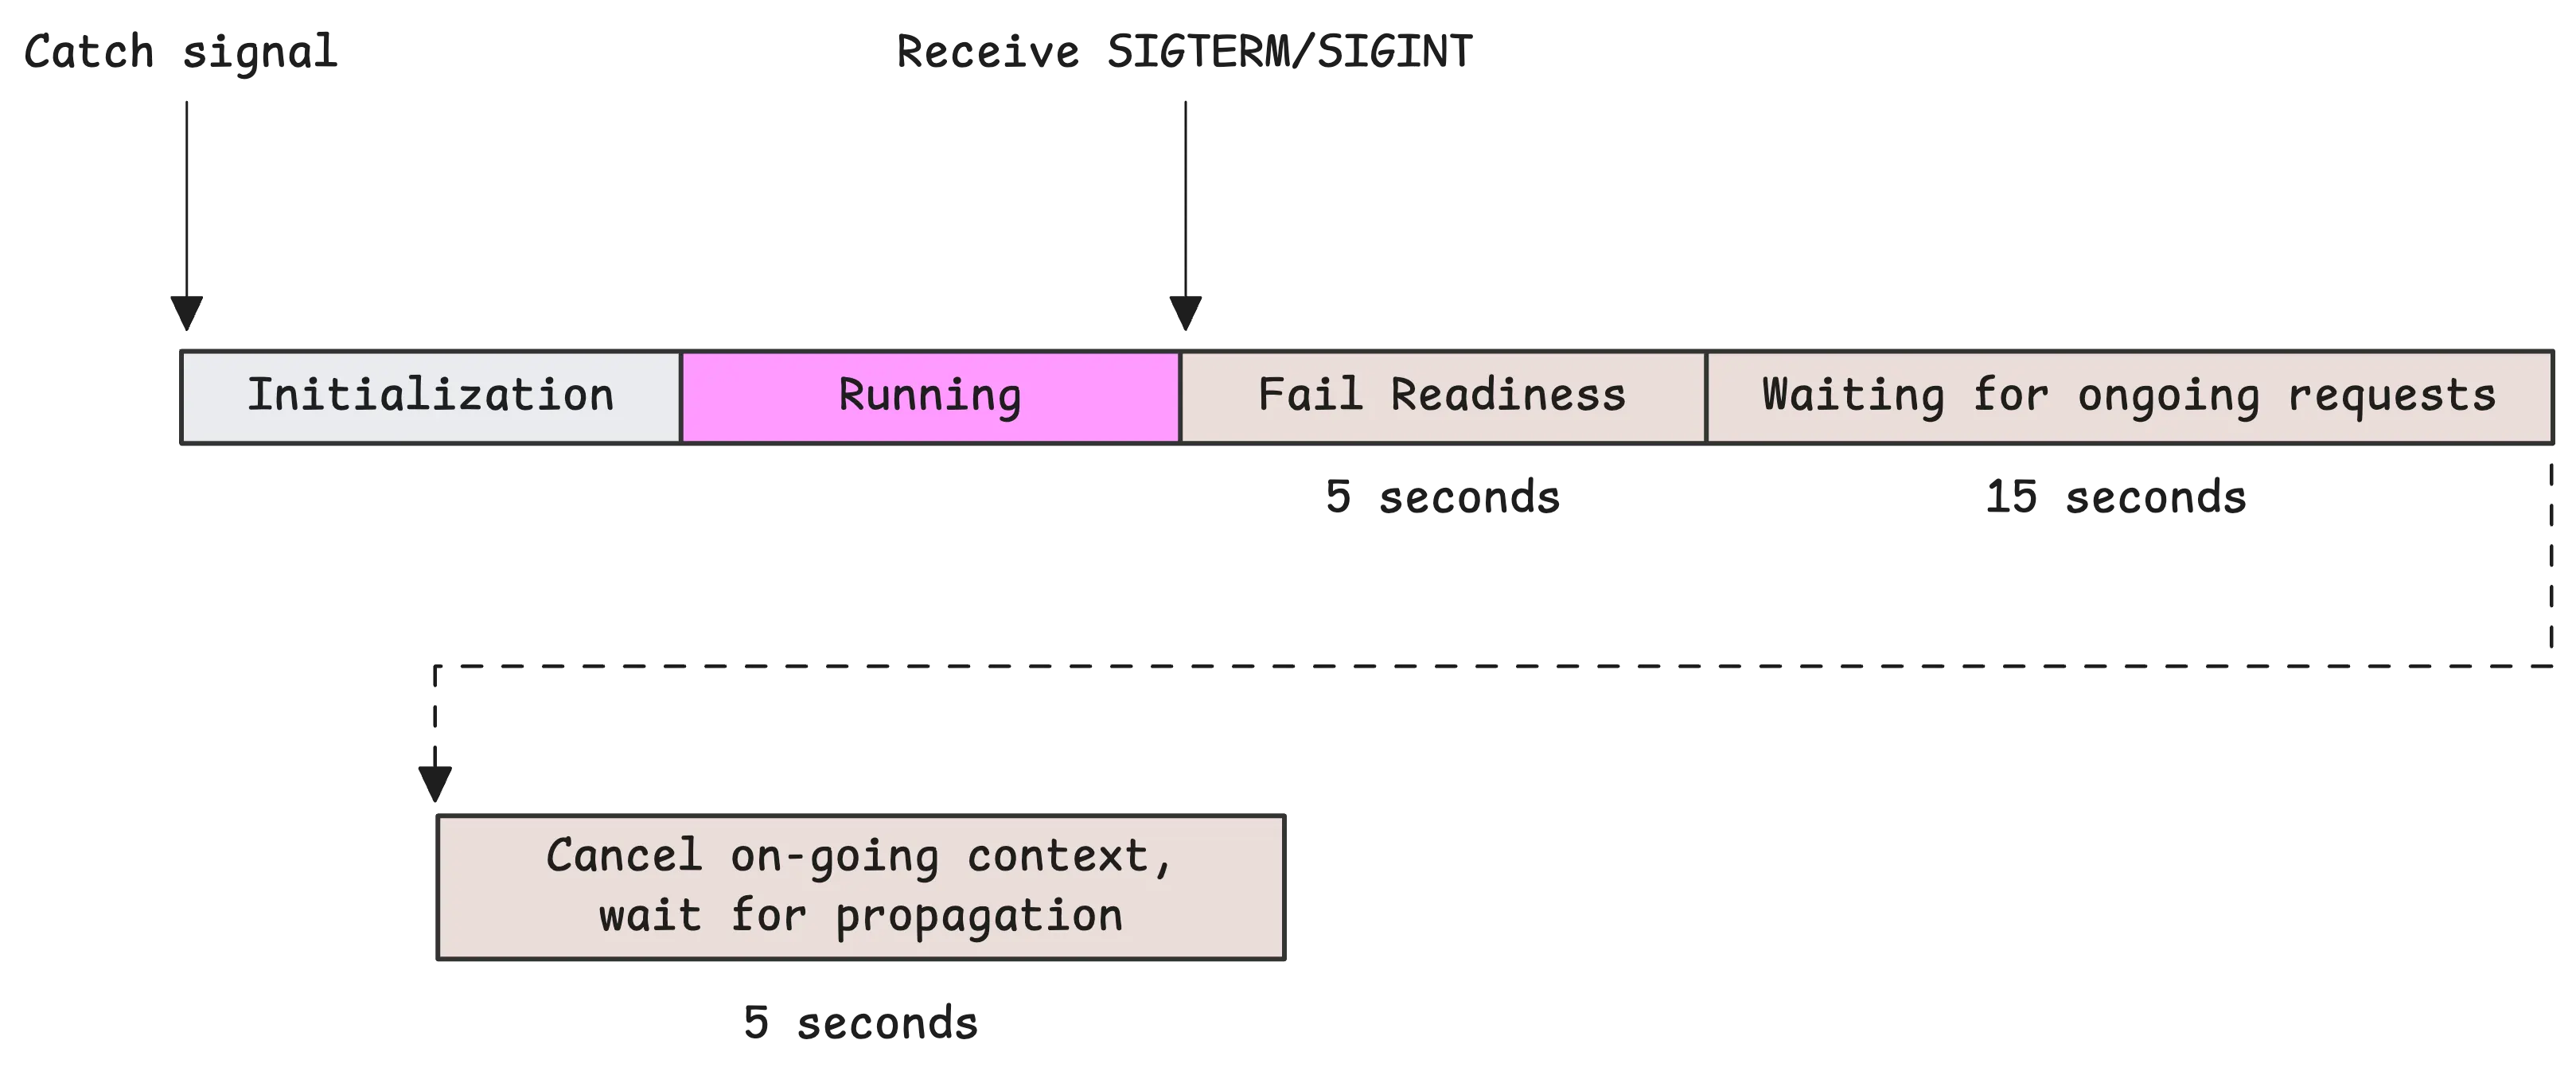
Now that we are shutting down the server gracefully, we need to choose a timeout based on your shutdown budget:
ctx, cancelFn := context.WithTimeout(context.Background(), timeout)
err := server.Shutdown(ctx)
The server.Shutdown function returns in only two situations:
- All active connections are closed and all handlers have finished processing.
- The context passed to
Shutdown(ctx)expires before the handlers finish. In this case, the server gives up waiting and forcefully closes all remaining connections.
In either case, Shutdown only returns after the server has completely stopped handling requests. This is why your handlers must be fast and context-aware. Otherwise, they may be cut off mid-process in case 2, which can cause issues like partial writes, data loss, inconsistent state, open transactions, or corrupted data.
A common issue is that handlers are not automatically aware when the server is shutting down.
So, how can we notify our handlers that the server is shutting down? The answer is by using context. There are two main ways to do this:
This middleware wraps each request with a context that listens to a shutdown signal:
func WithGracefulShutdown(next http.Handler, cancelCh <-chan struct{}) http.Handler {
 return http.HandlerFunc(func(w http.ResponseWriter, r *http.Request) {
 ctx, cancel := WithCancellation(r.Context(), cancelCh)
 defer cancel()

 r = r.WithContext(ctx)
 next.ServeHTTP(w, r)
 })
}
Here, we create a server with a custom BaseContext that can be canceled during shutdown. This context is shared across all incoming requests.
ongoingCtx, cancelFn := context.WithCancel(context.Background())
server := &http.Server{
 Addr: ":8080",
 Handler: yourHandler,
 BaseContext: func(l net.Listener) context.Context {
 return ongoingCtx
 },
}

// After attempting graceful shutdown:
cancelFn()
time.Sleep(5 * time.Second) // optional delay to allow context propagation
In an HTTP server, you can customize two types of contexts: BaseContext and ConnContext. For graceful shutdown, BaseContext is more suitable. It allows you to create a global context with cancellation that applies to the entire server, and you can cancel it to signal all active requests that the server is shutting down.
All of this work around graceful shutdown won’t help if your functions do not respect context cancellation. Try to avoid using context.Background(), time.Sleep(), or any other function that ignores context.
For example, time.Sleep(duration) can be replaced with a context-aware version like this:
func Sleep(ctx context.Context, duration time.Duration) error {
 select {
 case <-time.After(duration):
 return nil
 case <-ctx.Done():
 return ctx.Err()
 }
}
In older versions of Go, time.After can leak memory until the timer fires. This was fixed in Go 1.23 and newer. If you’re unsure which version you’re using, consider using time.NewTimer along with Stop and an optional <-t.C check if Stop returns false.
Although this article focuses on HTTP servers, the same concept applies to third-party services as well. For example, the database/sql package has a DB.Close method. It closes the database connection and prevents new queries from starting. It also waits for any ongoing queries to finish before fully shutting down.
The core principle of graceful shutdown is the same across all systems: Stop accepting new requests or messages, and give existing operations time to finish within a defined grace period.
Some may wonder about the server.Close() method, which shuts down the ongoing connections immediately without waiting for requests to finish. Can it be used after server.Shutdown() returns an error?
The short answer is yes, but it depends on your shutdown strategy. The Close method forcefully closes all active listeners and connections:
- Handlers that are actively using the network will receive errors when they try to read or write.
- The client will immediately receive a connection error, such as
ECONNRESET(‘socket hang up’) - However, long-running handlers that are not interacting with the network may continue running in the background.
This is why using context to propagate a shutdown signal is still the more reliable and graceful approach.
A common mistake is releasing critical resources as soon as the termination signal is received. At that point, your handlers and in-flight requests may still be using those resources. You should delay the resource cleanup until the shutdown timeout has passed or all requests are done.
In many cases, simply letting the process exit is enough. The operating system will automatically reclaim resources. For instance:
- Memory allocated by Go is automatically freed when the process terminates.
- File descriptors are closed by the OS.
- OS-level resources like process handles are reclaimed.
However, there are important cases where explicit cleanup is still necessary during shutdown:
- Database connections should be closed properly. If any transactions are still open, they need to be committed or rolled back. Without a proper shutdown, the database has to rely on connection timeouts.
- Message queues and brokers often require a clean shutdown. This may involve flushing messages, committing offsets, or signaling to the broker that the client is exiting. Without this, there can be rebalancing issues or message loss.
- External services may not detect the disconnect immediately. Closing connections manually allows those systems to clean up faster than waiting for TCP timeouts.
A good rule is to shut down components in the reverse order of how they were initialized. This respects dependencies between components.
Go’s defer statement makes this easier since the last deferred function is executed first:
db := connectDB()
defer db.Close()

cache := connectCache()
defer cache.Close()
Some components require special handling. For example, if you cache data in memory, you might need to write that data to disk before exiting. In those cases, design a shutdown routine specific to that component to handle the cleanup properly.
This is a complete example of a graceful shutdown mechanism. It is written in a flat, straightforward structure to make it easier to understand. You can customize it to fit your own application as needed.
const (
	_shutdownPeriod = 15 * time.Second
	_shutdownHardPeriod = 3 * time.Second
	_readinessDrainDelay = 5 * time.Second
)

var isShuttingDown atomic.Bool

func main() {
	// Setup signal context
	rootCtx, stop := signal.NotifyContext(context.Background(), syscall.SIGINT, syscall.SIGTERM)
	defer stop()

	// Readiness endpoint
	http.HandleFunc("/healthz", func(w http.ResponseWriter, r *http.Request) {
 if isShuttingDown.Load() {
 http.Error(w, "Shutting down", http.StatusServiceUnavailable)
 return
 }
 fmt.Fprintln(w, "OK")
	})

	// Sample business logic
	http.HandleFunc("/", func(w http.ResponseWriter, r *http.Request) {
 select {
 case <-time.After(2 * time.Second):
 fmt.Fprintln(w, "Hello, world!")
 case <-r.Context().Done():
 http.Error(w, "Request cancelled.", http.StatusRequestTimeout)
 }
	})

	// Ensure in-flight requests aren't cancelled immediately on SIGTERM
	ongoingCtx, stopOngoingGracefully := context.WithCancel(context.Background())
	server := &http.Server{
 Addr: ":8080",
 BaseContext: func(_ net.Listener) context.Context {
 return ongoingCtx
 },
	}

	go func() {
 log.Println("Server starting on :8080.")
 if err := server.ListenAndServe(); err != nil && err != http.ErrServerClosed {
 log.Fatalf("ListenAndServe: %v", err)
 }
	}()

	// Wait for signal
	<-rootCtx.Done()
	stop()
	isShuttingDown.Store(true)
	log.Println("Received shutdown signal, shutting down.")

	// Give time for readiness check to propagate
	time.Sleep(_readinessDrainDelay)
	log.Println("Readiness check propagated, now waiting for ongoing requests to finish.")

	shutdownCtx, cancel := context.WithTimeout(context.Background(), _shutdownPeriod)
	defer cancel()
	err := server.Shutdown(shutdownCtx)
	stopOngoingGracefully()
	if err != nil {
 log.Println("Failed to wait for ongoing requests to finish, waiting for forced cancellation.")
 time.Sleep(_shutdownHardPeriod)
	}

	log.Println("Server shut down gracefully.")
}
If you want to monitor your services, track metrics, and see how everything performs, you might want to check out VictoriaMetrics. It’s a fast, open-source, and cost-saving way to keep an eye on your infrastructure.
And we’re Gophers, enthusiasts who love researching, experimenting, and sharing knowledge about Go and its ecosystem. If you spot anything that’s outdated or if you have questions, don’t hesitate to reach out. You can drop me a DM on X(@func25).
Related articles:
Read the original article
Comments
I've been bitten by the surprising amount of time it takes for Kubernetes to update loadbalancer target IPs in some configurations. For me, 90% of the graceful shutdown battle was just ensuring that traffic was actually being drained before pod termination.
Adding a global preStop hook with a 15 second sleep did wonders for our HTTP 503 rates. This creates time between when the loadbalancer deregistration gets kicked off, and when SIGTERM is actually passed to the application, which in turn simplifies a lot of the application-side handling.
By rdsubhas 2025-05-0517:59 Yes. Prestop sleep is the magic SLO solution for high quality rolling deployments.
IMHO, there are two things that kubernetes could improve on:
1. Pods should be removed from Endoints _before_ initiating the shutdown sequence. Like the termination grace, there should be an option for termination delay. 2. PDB should allow an option for recreation _before_ eviction.
By LazyMans 2025-05-0514:39 We just realized this was a problem too
By evil-olive 2025-05-0423:144 reply another factor to consider is that if you have a typical Prometheus `/metrics` endpoint that gets scraped every N seconds, there's a period in between the "final" scrape and the actual process exit where any recorded metrics won't get propagated. this may give you a false impression about whether there are any errors occurring during the shutdown sequence.
it's also possible, if you're not careful, to lose the last few seconds of logs from when your service is shutting down. for example, if you write to a log file that is watched by a sidecar process such as Promtail or Vector, and on startup the service truncates and starts writing to that same path, you've got a race condition that can cause you to lose logs from the shutdown.
Is it me or are observability stacks kind of ridiculous. Logs, metrics, and traces, each with their own databases, sidecars, visualization stacks. Language-specific integration libraries written by whoever felt like it. MASSIVE cloud bills.
Then after you go through all that effort most of the data is utterly ignored and rarely are the business insights much better then the trailer park version ssh'ing into a box and greping a log file to find the error output.
Like we put so much effort into this ecosystem but I don't think it has paid us back with any significant increase in uptime, performance, or ergonomics.
I can say that going from a place that had all of that observability tooling set up to one that was at the "ssh'ing into a box and greping a log" stage, you best believe I missed company A immensely. Even knowing which box to ssh into, which log file to grep, and which magic words to search far was nigh impossible if you weren't the dev that set up the machine and wrote the bug in the first place.
By MortyWaves 2025-05-050:481 reply I completely agree with you but I also think, like many aspects of "tech" certain segments of it have been monopolised and turned into profit generators for certain organisations. DevOps, Agile/Scrum, Observability, Kubernetes, are all examples of this.
This dilutes the good and helpful stuff with marketing bullshit.
Grafana seemingly inventing new time series databases and engines every few months is absolutely painful to try keep up to date with in order to make informed decisions.
So much so I've started using rrdtool/smokeping again.
By bbkane 2025-05-055:05 You might look into https://openobserve.ai/ - you can self host it and it's a single binary that ingests logs/metrics/traces. I've found it useful for my side projects.
By evil-olive 2025-05-051:39 if you're working on a system simple enough that "SSH to the box and grep the log file" works, then by all means have at it.
but many systems are more complicated than that. the observability ecosystem exists for a reason, there is a real problem that it's solving.
for example, your app might outgrow running on a single box. now you need to SSH into N different hosts and grep the log file from all of them. or you invent your own version of log-shipping with a shell script that does SCP in a loop.
going a step further, you might put those boxes into an auto-scaling group so that they would scale up and down automatically based on demand. now you really want some form of automatic log-shipping, or every time a host in the ASG gets terminated, you're throwing away the logs of whatever traffic it served during its lifetime.
or, maybe you notice a performance regression and narrow it down to one particular API endpoint being slow. often it's helpful to be able to graph the response duration of that endpoint over time. has it been slowing down gradually, or did the response time increase suddenly? if it was a sudden increase, what else happened around the same time? maybe a code deployment, maybe a database configuration change, etc.
perhaps the service you operate isn't standalone, but instead interacts with services written by other teams at your company. when something goes wrong with the system as a whole, how do you go about root-causing the problem? how do you trace the lifecycle of a request or operation through all those different systems?
when something goes wrong, you SSH to the box and look at the log file...but how do you know something went wrong to begin with? do you rely solely on user complaints hitting your support@ email? or do you have monitoring rules that will proactively notify you if a "huh, that should never happen" thing is happening?
Overall, I think centralized logging and metrics are super valuable. But stacks are all missing the mark. For example, every damn log message has hundreds of fields,. Most of which never change. Why not push this information once, on service startup an not with every log message? OK, obviously the current system provides huge bills to the benefit of the company or's offering these services.
By valyala 2025-05-0522:43 > For example, every damn log message has hundreds of fields,. Most of which never change. Why not push this information once, on service startup an not with every log message?
If the log field doesn't change with every log entry, then good databases for logs (such as VictoriaLogs) compress such a field by 1000x and more times, so its' storage space usage can be ignored, and it doesn't affect query performance in any way.
Storing many fields per every log entry simplifies further analysis of these logs, since you can get all the needed information from a single log entry instead of jumping over big number of interconnected logs. This also improves analysis of logs at scale by filtering and grouping the logs by any subset of numerous fields. Such logs with big number of fields are named "wide events". See the following excellent article about this type of logs - https://jeremymorrell.dev/blog/a-practitioners-guide-to-wide... .
By 01HNNWZ0MV43FF 2025-05-051:09 Programs are for people. That's why we got JSON, a bunch of debuggers, Python, and so on. Programming is only like 10 percent of programming
By openWrangler 2025-05-0619:12 It's not just you - OSS toolstacks can be sprawling and involve long manual processes while costs from most enterprise vendors are too steep for fully mapped observability.
Coroot is an open source project I'm working with to try and to tackle this. eBPF automatically gathers your data into a centralized service map, and then the tool provides RCA insights (with things like mapped incident timeframes) to help implement fixes quicker and improve uptime.
GitHub here and we'd love any feedback if you think it can help: https://github.com/coroot/coroot
Jfyi, I'm doing exactly this (and more) in a platform library; it covers the issues I've encountered during the last 8+ years I've been working with Go highload apps. During this time developing/improving the platform and rolling was a hobby of mine in every company :)
It (will) cover the stuff like "sync the logs"/"wait for ingresses to catch up with the liveness handler"/etc.
https://github.com/utrack/caisson-go/blob/main/caiapp/caiapp...
https://github.com/utrack/caisson-go/tree/main/closer
The docs are sparse and some things aren't covered yet; however I'm planning to do the first release once I'm back from a holiday.
In the end, this will be a meta-platform (carefully crafted building blocks), and a reference platform library, covering a typical k8s/otel/grpc+http infrastructure.
By peterldowns 2025-05-0514:27 I'll check this out, thanks for sharing. I think all of us golang infra/platform people probably have had to write our own similar libraries. Thanks for sharing yours!
By RainyDayTmrw 2025-05-051:392 reply I never understood why Prometheus and related use a "pull" model for data, when most things use a "push" model.
That’s an artifact of the original google’s borgmon design. Fwiw, in a “v2” system at Google they tried switching to push-only and it went sideways so they settled on sort of hybrid pull-push streaming api
By evil-olive 2025-05-052:333 reply Prometheus doesn't necessarily lock you into the "pull" model, see [0].
however, there are some benefits to the pull model, which is why I think Prometheus does it by default.
with a push model, your service needs to spawn a background thread/goroutine/whatever that pushes metrics on a given interval.
if that background thread crashes or hangs, metrics from that service instance stop getting reported. how do you detect that, and fire an alert about it happening?
"cloud-native" gets thrown around as a buzzword, but this is an example where it's actually meaningful. Prometheus assumes that whatever service you're trying to monitor, you're probably already registering each instance in a service-discovery system of some kind, so that other things (such as a load-balancer) know where to find it.
you tell Prometheus how to query that service-discovery system (Kubernetes, for example [1]) and it will automatically discover all your service instances, and start scraping their /metrics endpoints.
this provides an elegant solution to the "how do you monitor a service that is up and running, except its metrics-reporting thread has crashed?" problem. if it's up and running, it should be registered for service-discovery, and Prometheus can trivially record (this is the `up` metric) if it discovers a service but it's not responding to /metrics requests.
and this greatly simplifies the client-side metrics implementation, because you don't need a separate metrics thread in your service. you don't need to ensure it runs forever and never hangs and always retries and all that. you just need to implement a single HTTP GET endpoint, and have it return text in a format simple enough that you can sprintf it yourself if you need to.
for a more theoretical understanding, you can also look at it in terms of the "supervision trees" popularized by Erlang. parents monitor their children, by pulling status from them. children are not responsible for pushing status reports to their parents (or siblings). with the push model, you have a supervision graph instead of a supervision tree, with all the added complexity that entails.
0: https://prometheus.io/docs/instrumenting/pushing/
1: https://prometheus.io/docs/prometheus/latest/configuration/c...
By raffraffraff 2025-05-057:50 Great answer. I managed metrics systems way back (cacti, nagios, graphite, kairosdb) and one thing that always sucked about push based metrics was coping with variable volume of data coming from an uncontrollable number of sources. Scaling was a massive headache. "Scraping" helps to solve this through splitting duty across a number of "scrapers" that autodiscover sources. And by placing limits on how much it will scrape from any given metrics source, you can effectively protect the system from overload. Obviously this comes at the expense of dropping metrics from noisy sources, but as the metrics owner I say "too bad, your fault, fix your metrics". Back in the old days you had to accept whatever came in through the fire hose.
By sporkland 2025-05-1314:15 Having operated a large site with 1000's of services I've never had the metrics thread crash on a service. I've often seen the telemetry pipeline crash. If you've been writing the metrics to logs in a thread you at least have a chance to recover and backfill that information when you fix the pipeline.
By bbkane 2025-05-055:03 Thanks for writing this out; very insightful!
By PrayagS 2025-05-0514:36 > another factor to consider is that if you have a typical Prometheus `/metrics` endpoint that gets scraped every N seconds, there's a period in between the "final" scrape and the actual process exit where any recorded metrics won't get propagated. this may give you a false impression about whether there are any errors occurring during the shutdown sequence.
Have you come across any convenient solution for this? If my scrape interval is 15 seconds, I don't exactly have 30 seconds to record two scrapes.
This behavior has sort of been the reason why our services still use statsd since the push-based model doesn't see this problem.
By karel-3d 2025-05-0511:43 one tiny thing I see quite often: people think that if you do `log.Fatal`, it will still run things in `defer`. It won't!
this just runs "fatal"... because log.Fatal calls os.Exit, and that closes everything immediately.package main import ( "fmt" "log" ) func main() { defer fmt.Println("in defer") log.Fatal("fatal") }
This shows both `fatal` and `in defer`package main import ( "fmt" "log" ) func main() { defer fmt.Println("in defer") panic("fatal") }
