P-Hacking in Startups

2025-06-189:56301138briefer.cloud

When agile experimentation at startups becomes a p-hacking trap

Speed kills rigor. In startups, the pressure to ship fast pushes teams to report anything that looks like an improvement. That’s how p-hacking happens. This piece breaks down three common cases—and how to avoid them.


Example 01: Multiple comparisons without correction

Imagine you're a product manager trying to optimize your website’s dashboard. Your goal is to increase user signups. Your team designs four different layouts: A, B, C, and D.

You run an A/B/n test. Users are randomly assigned to one of the four layouts and you track their activity. Your hypothesis is: layout influences signup behavior.

You plan ship the winner if the p-value for one of the layout choices falls below the conventional threshold of 0.05.

Then you check the results:

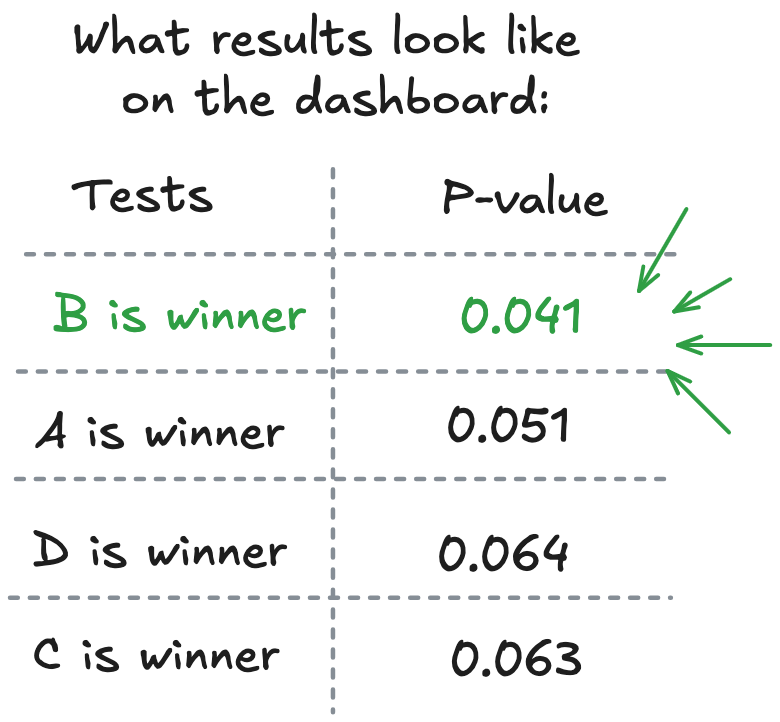
Option B looks best. p = 0.041. It floats to the top as if inviting action. The team is satisfied and ships it.

But the logic beneath the 0.05 cutoff is more fragile than it appears. That threshold assumes you’re testing a single variant. But you tested four. That alone increases the odds of a false positive.

Let’s look at what that actually means.

Setting a p-value threshold of 0.05 is equivalent to saying: "I’m willing to accept a 5% chance of shipping something that only looked good by chance."

So the probability that one test doesn’t result in a false positive is:

10.05=0.951−0.05=0.9510.05=0.95

Now, if you run 4 independent tests, the probability that none of them produce a false positive is:

0.95×0.95×0.95×0.95=0.81450.95 \times 0.95 \times 0.95 \times 0.95 = 0.81450.95×0.95×0.95×0.95=0.8145

That means the probability that at least one test gives you a false positive is:

10.8145=0.18551 − 0.8145 = 0.185510.8145=0.1855

So instead of working with a 5% false positive rate, you’re actually closer to 18.5%: nearly a 1 in 5 risk that you're shipping something based on a fluke.

And that risk scales quickly. The more variants you test, the higher the odds that something looks like a win just by coincidence. Statistically, the probability of at least one false positive increases with each additional test, converging toward 1 as the number of comparisons grows:

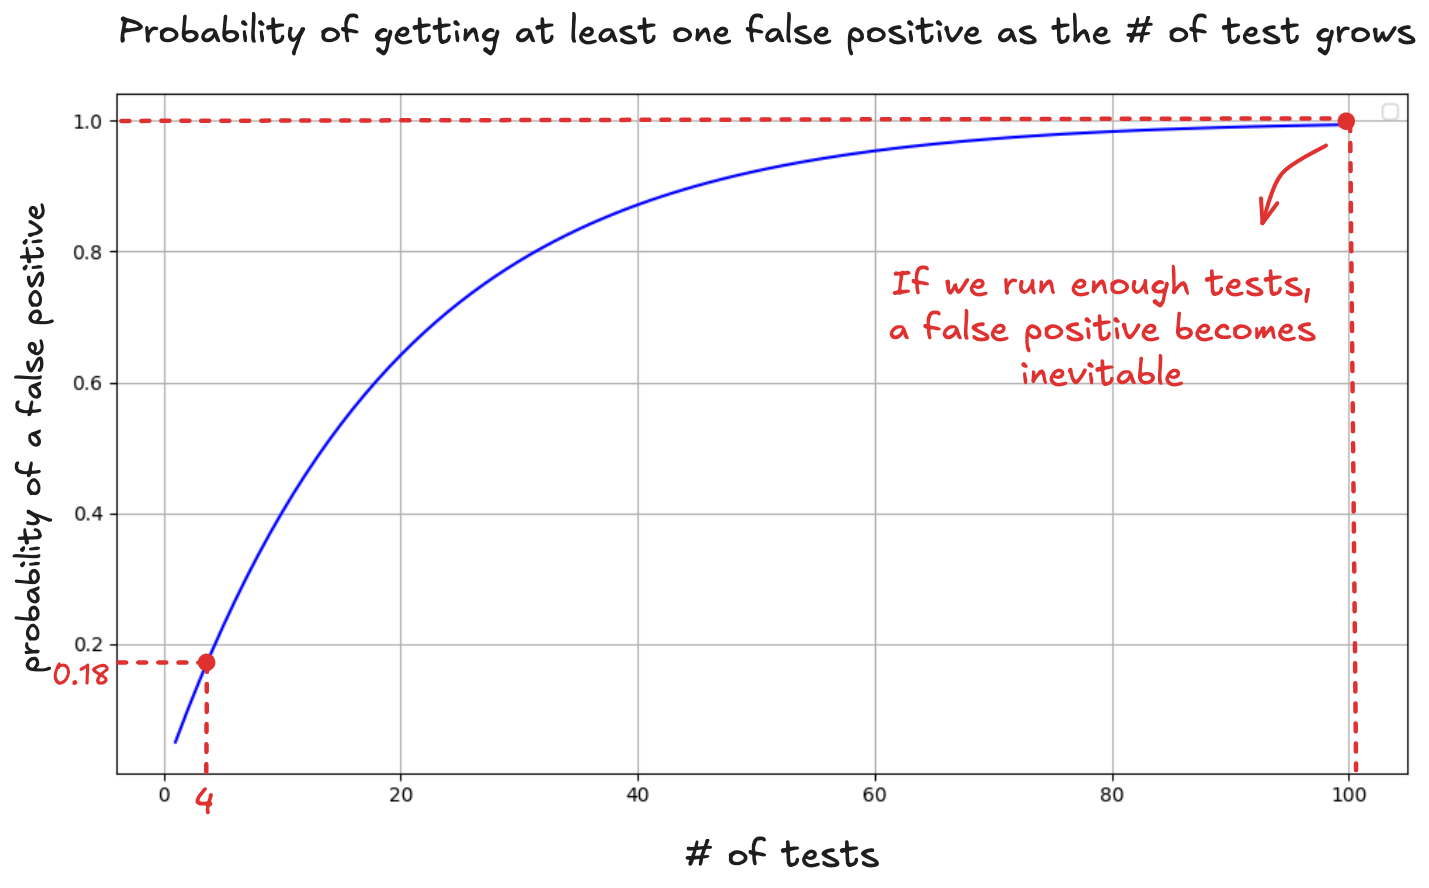
Bottom line: you ran a four-arm experiment but interpreted it like a one-arm test. You never adjusted your cutoff to account for multiple comparisons. Which means the p-value you relied on doesn’t mean what you think it does.

This is p-hacking. You looked at the results, picked the one that cleared the bar, and ignored the fact that the bar was never calibrated for this setup.

How to avoid this: adjusting the threshold

The Bonferroni Correction is one way to avoid using the wrong cutoff when testing for multiple options. It's straightforward: you account for the number of hypotheses k by adjusting the acceptable p-value for significance:

adjusted threshold=0.05k \text{adjusted threshold}= \frac{0.05}{k}adjusted threshold=k0.05

In our dashboard test with 4 variants, that’s:

0.054=0.0125\frac{0.05}{4} = 0.012540.05=0.0125

Under this correction, only p-values below 0.0125 should be considered significant. Your p = 0.041 result? It no longer qualifies.

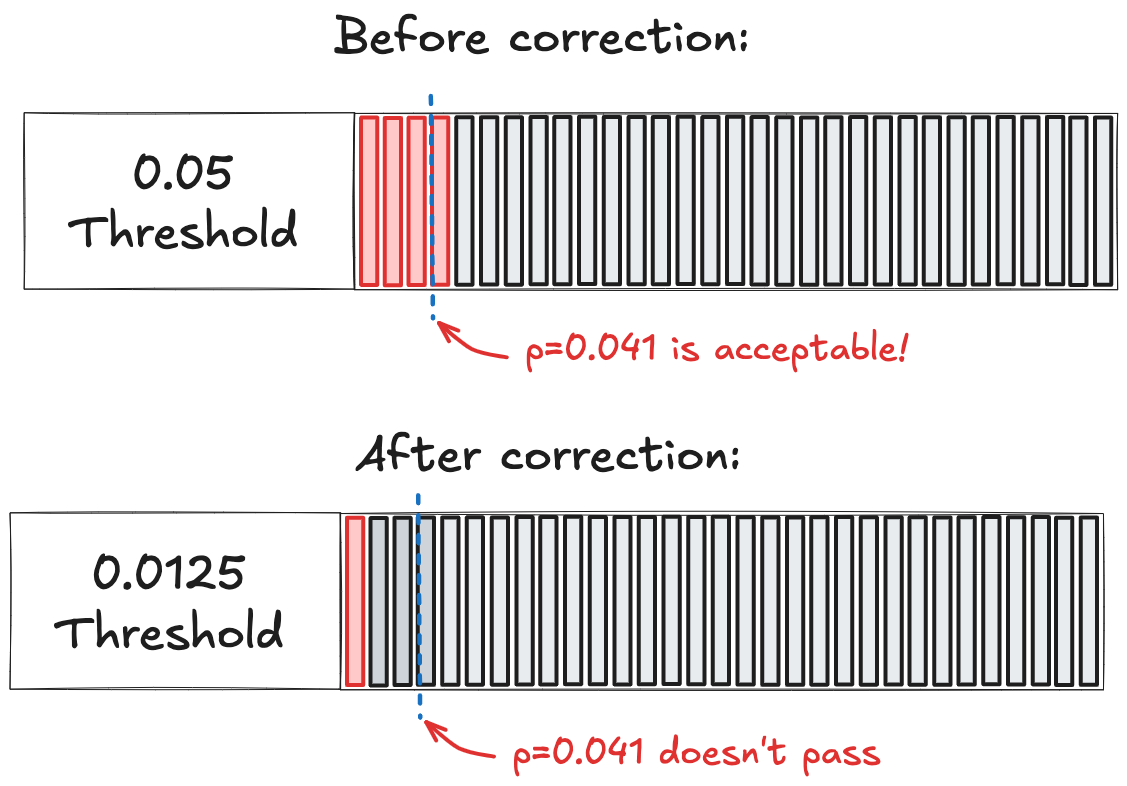
Fewer results will pass the bar. That can feel frustrating in fast-moving product teams. But now you're actually measuring something you can trust.


Example 02: Reframing the metric after the results are in

Back to the dashboard experiment: after you applied the Bonferroni correction you got... nothing. None of your dashboard variants significantly improved user signup rates.

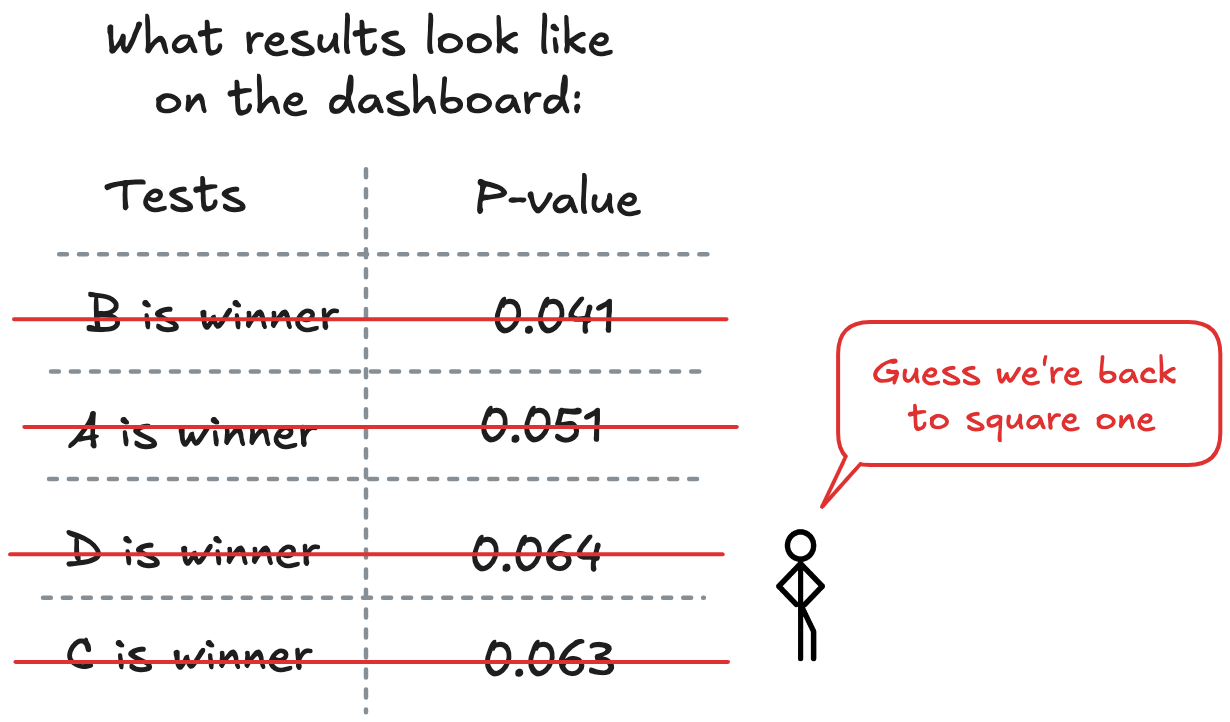
This is frustrating. You've invested weeks in the redesign, and you're facing a product review with no wins to show. Nobody likes arriving empty-handed to leadership meetings.

So you dig deeper. The data's already collected so why not explore other insights? Maybe signups didn't improve, but what about retention? You check for retention rates and discover something interesting:

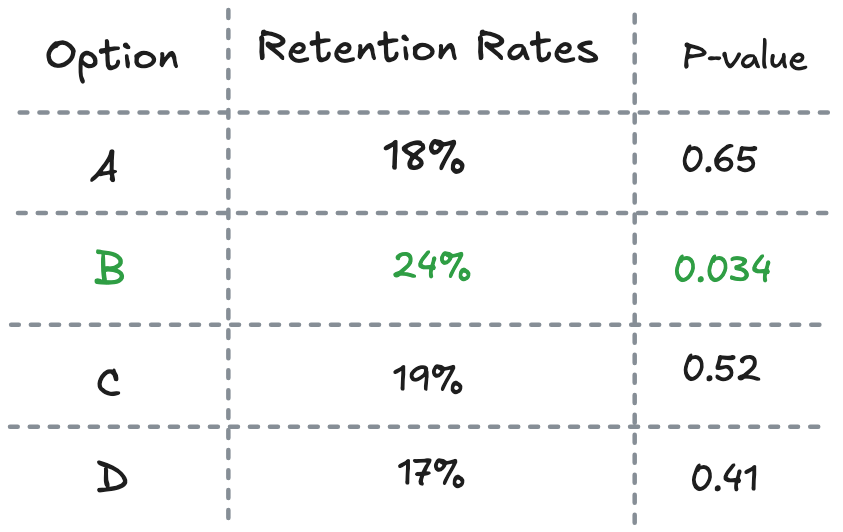
Option B shows slightly higher retention than the rest, with p = 0.034. Suddenly your narrative shifts: "This experiment was really about improving retention all along!"

You pivot the story and now it’s tempting to call it a win for B and ship it. But each extra metric you check is another chance for randomness to sneak in. If you check 20 metrics, the odds that at least one will look like a winner by pure chance shoot up to about two in three. That’s because the probability that none of the 20 metrics show a false positive is:

1(10.05)9=641−(1−0.05)^9 =64%1(10.05)9=64

Graphically, it looks like this:

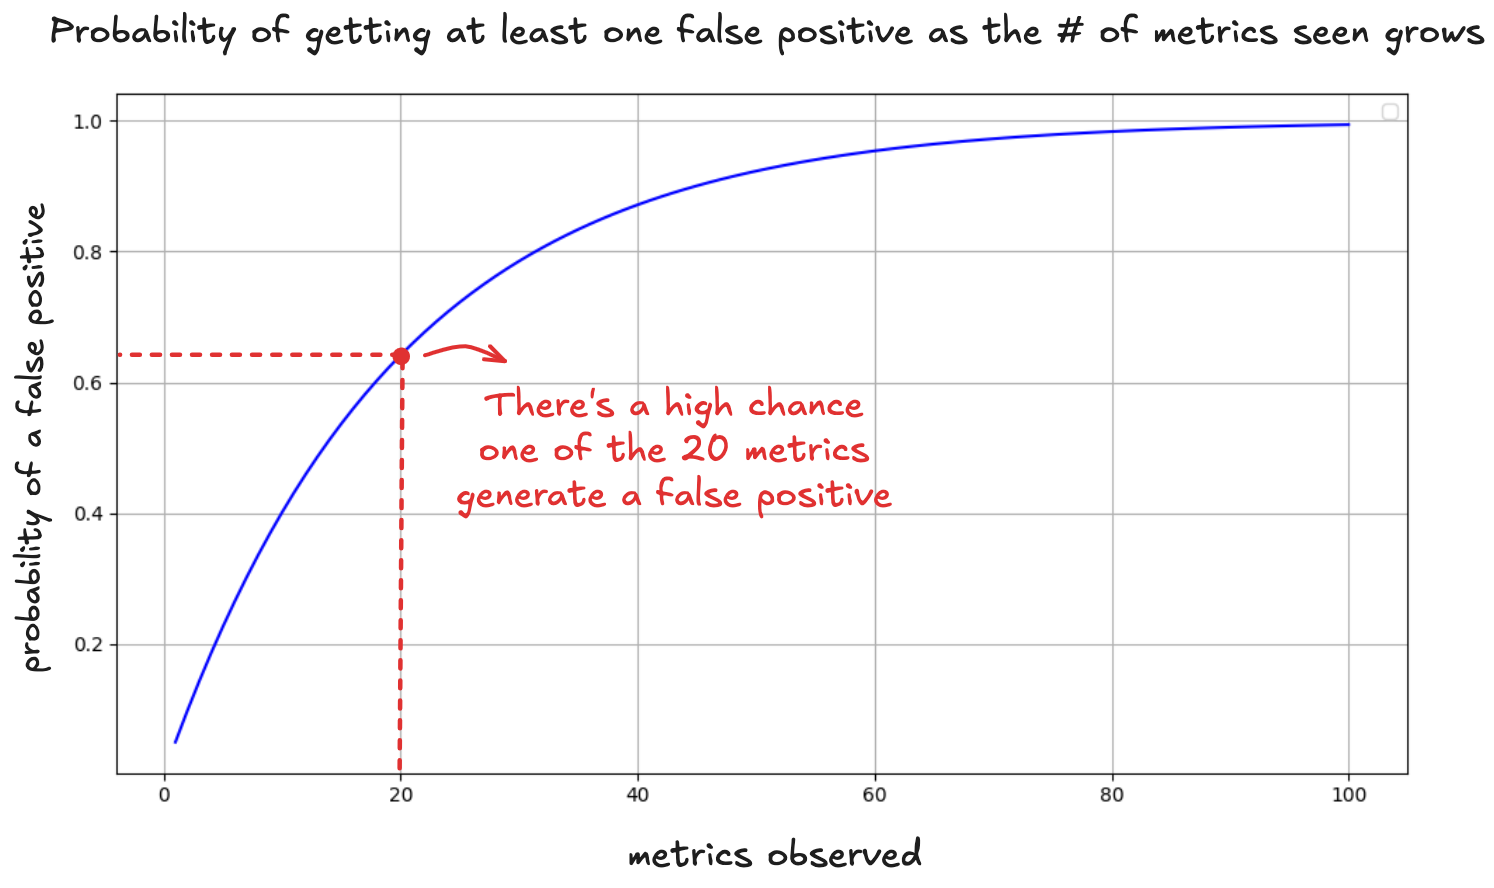
That promising retention improvement? It’s just the kind of anomaly you’d expect to find after enough digging.

The pre-registration solution

Each time you add a new metric, you increase the chance of finding a false positive. A single test with a threshold of p < 0.05 implies a 5 percent risk of error. But the more tests you run, the more that risk accumulates. In the limit, it approaches certainty.

Pre-registration prevents this. By stating in advance which metric will count as evidence, you fix the false positive rate at its intended level. The p-value retains its meaning. You are testing one hypothesis, not several in disguise.

Decide your success metrics before running the test. Document them explicitly and stick to them.

This isn't academic nit-picking. It's how medical research works when lives are on the line. Your startup's growth deserves the same rigor.


Example 03: Running experiments until we get a hit

Even if you’ve accounted for multiple variants and didn't the temptation to shift metrics, one bias remains: impatience. The lure of early results is difficult to ignore and can lead to bad decisions

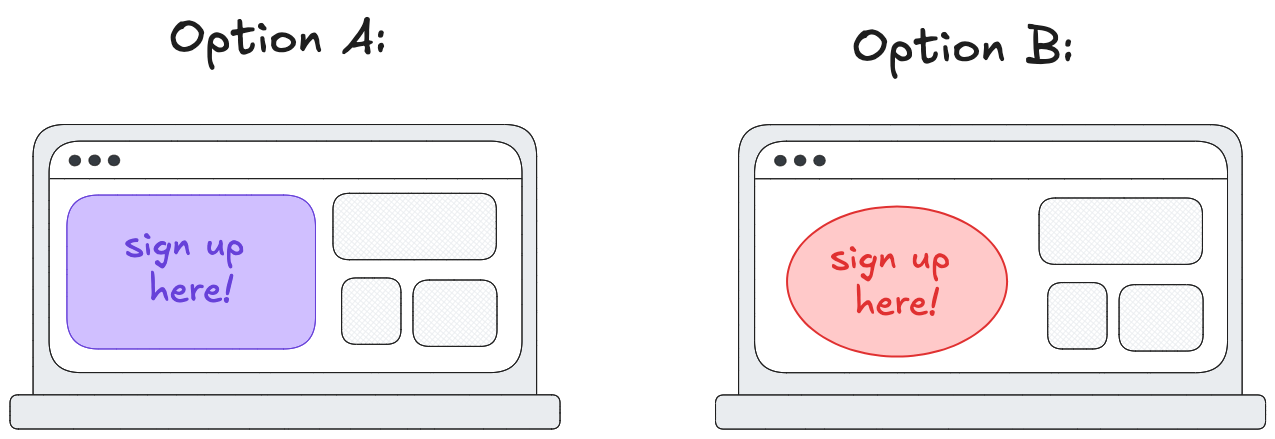
Now you're running an A/B test of two button styles, scheduled for two weeks.

Each day, you check the dashboard, just in case. On the ninth day, the p-value for button B dips to 0.048:

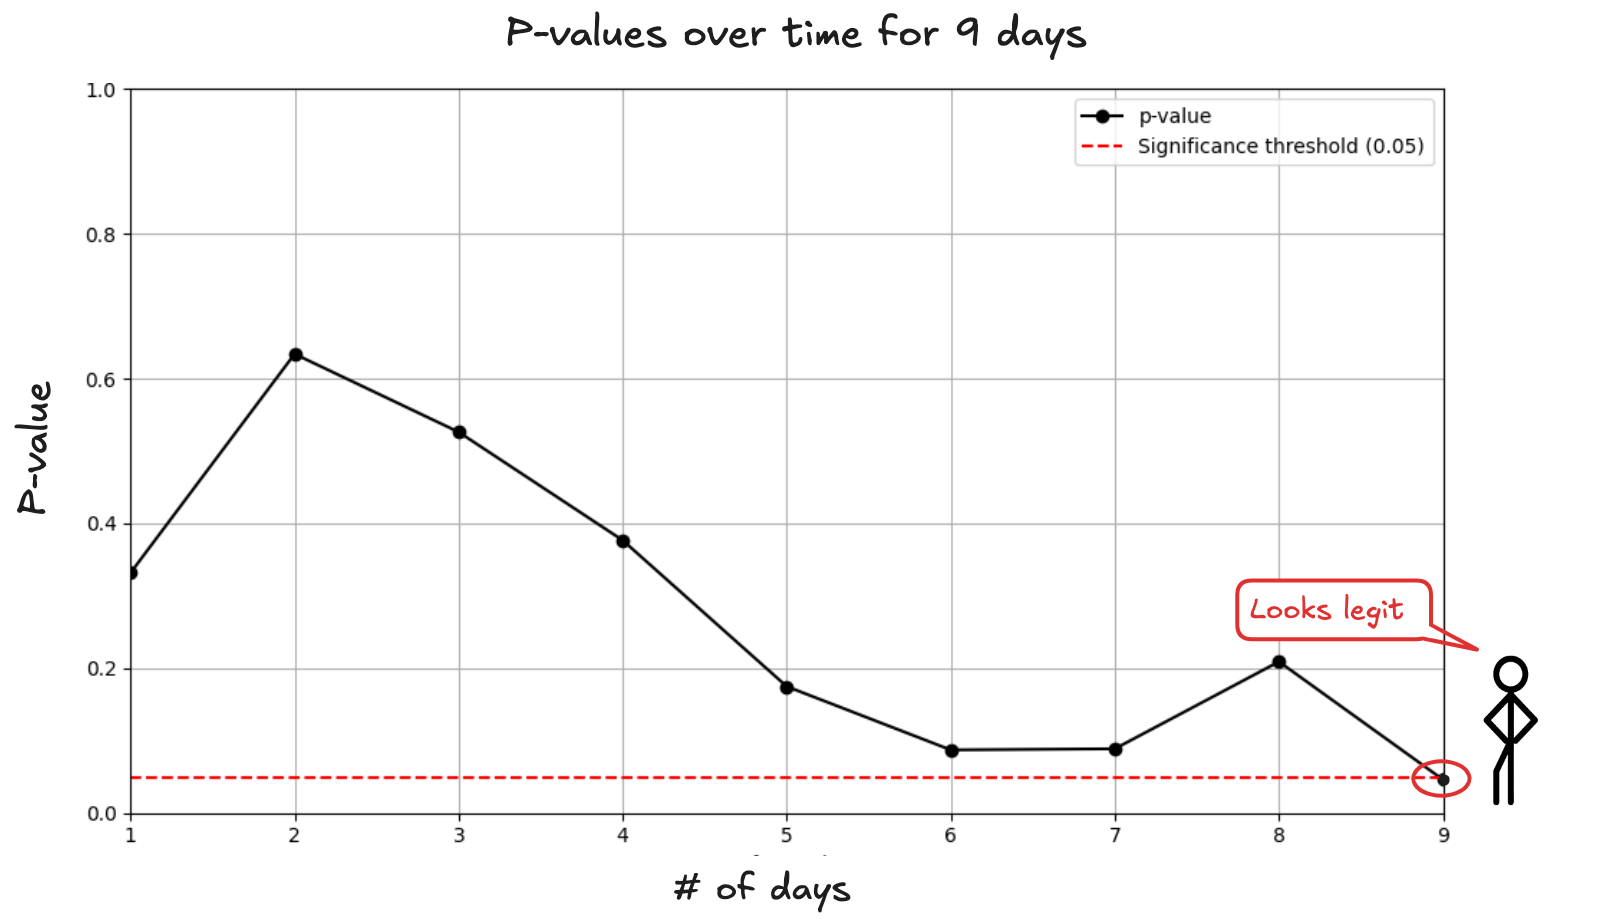
Should you stop the test and ship B? At this point, you know a win shouldn’t come that easily. A p-value only works if you set your stopping rule in advance. Peeking the p-value each day during nine days is like you’re running nine experiments. Each day is a new opportunity for randomness to look like signal.

After 9 peeks, the probability that at least one p-value dips below 0.05 is:

1(10.05)9=371−(1−0.05)^9 =37%1(10.05)9=37

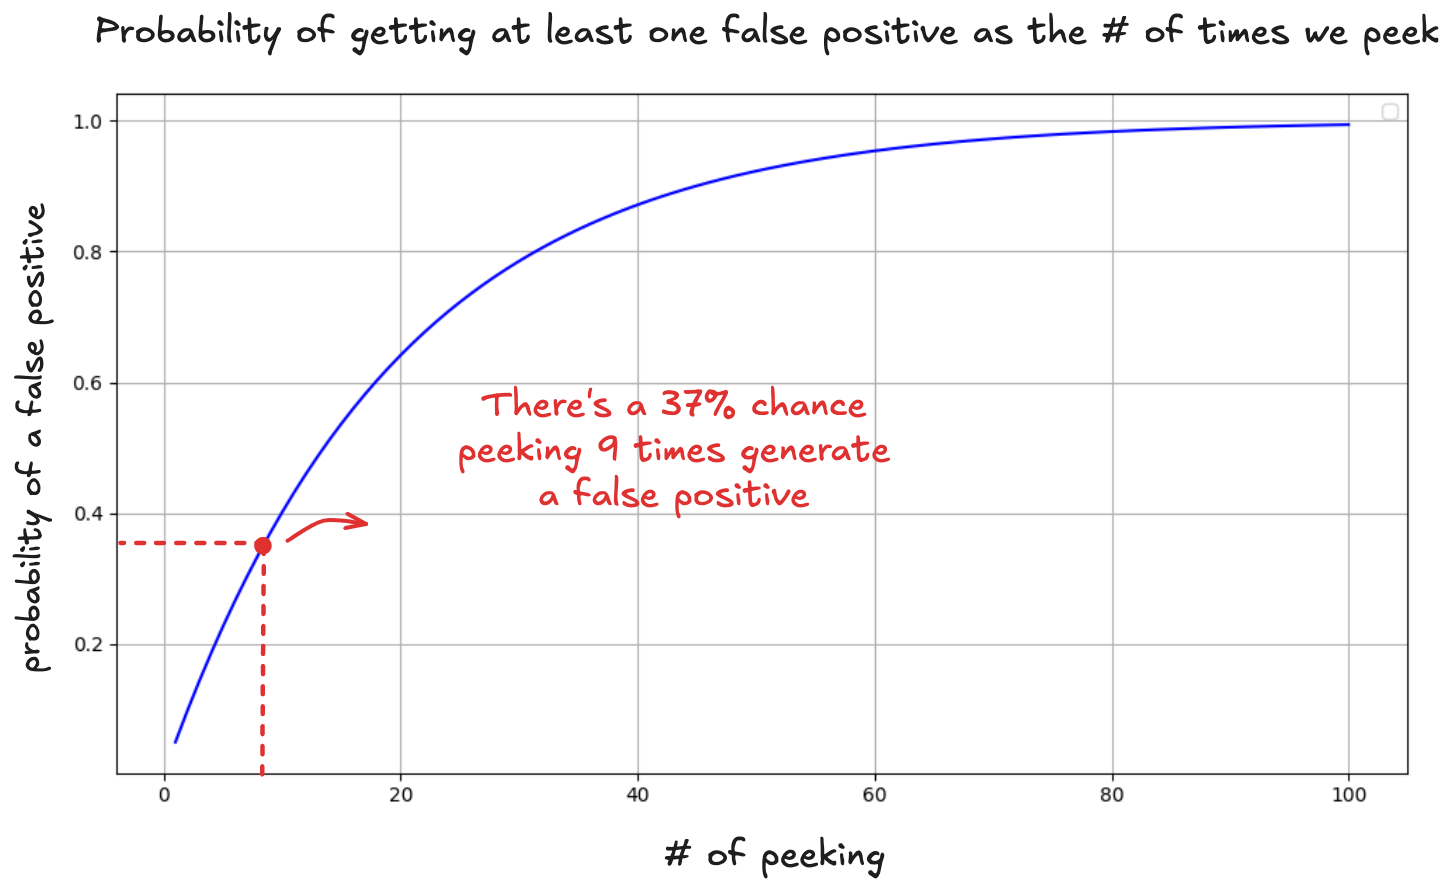
And there’s another subtle trap: by not waiting for the experiment to finish, you’re watching the p-value bounce around as new data arrives. That "significant" result on day 9 might be nothing more than a lucky swing, gone by day 14:

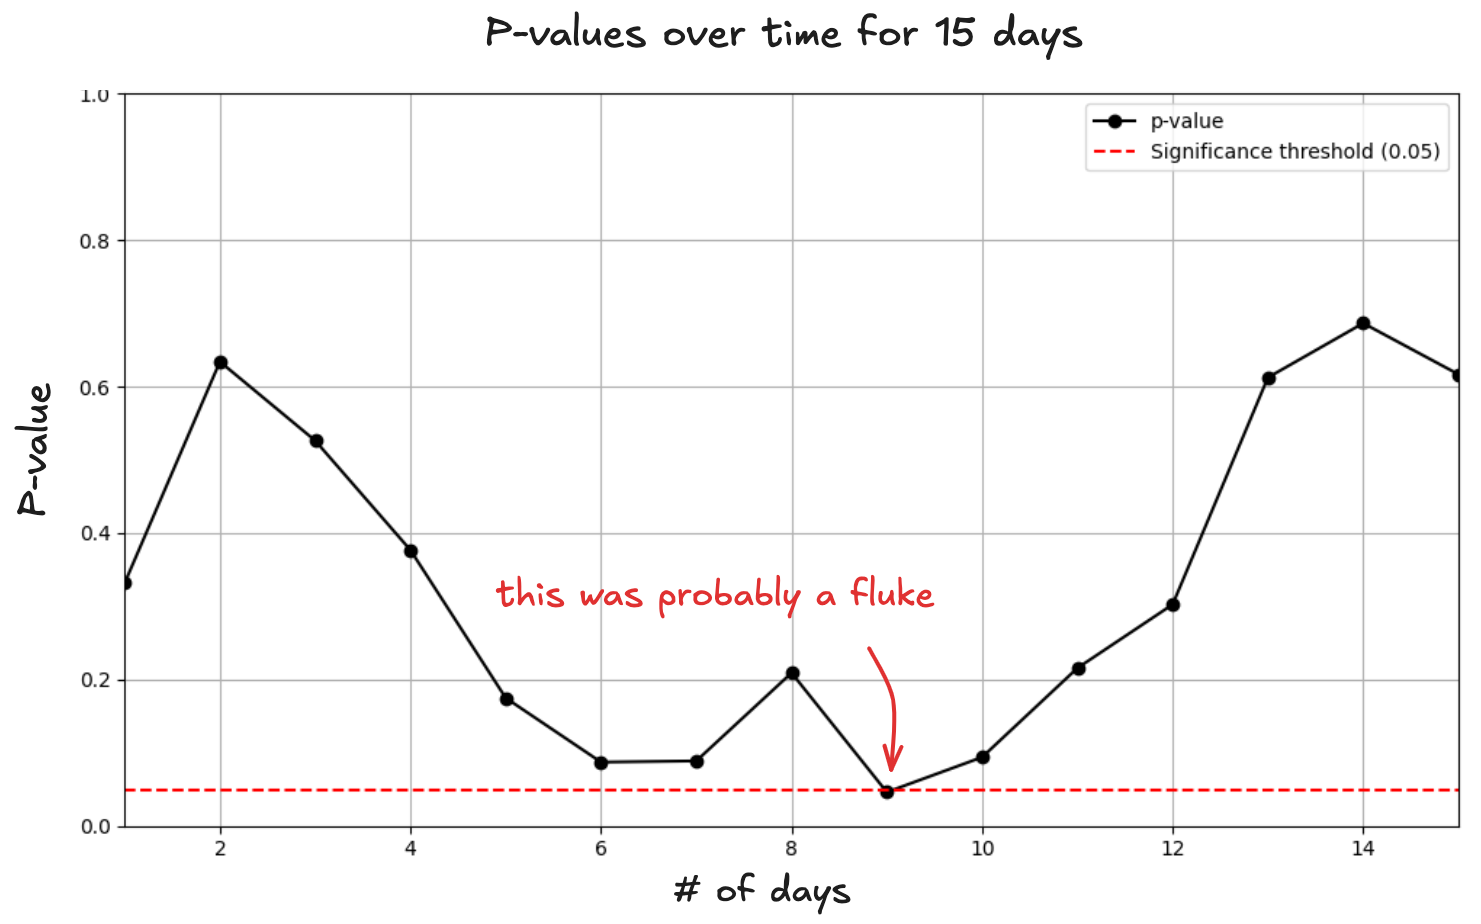
Shipping on an early p-value is like betting on a horse halfway around the track.

How to properly peek

If you absolutely must make early stopping decisions, here’s how to do it responsibly using sequential testing.

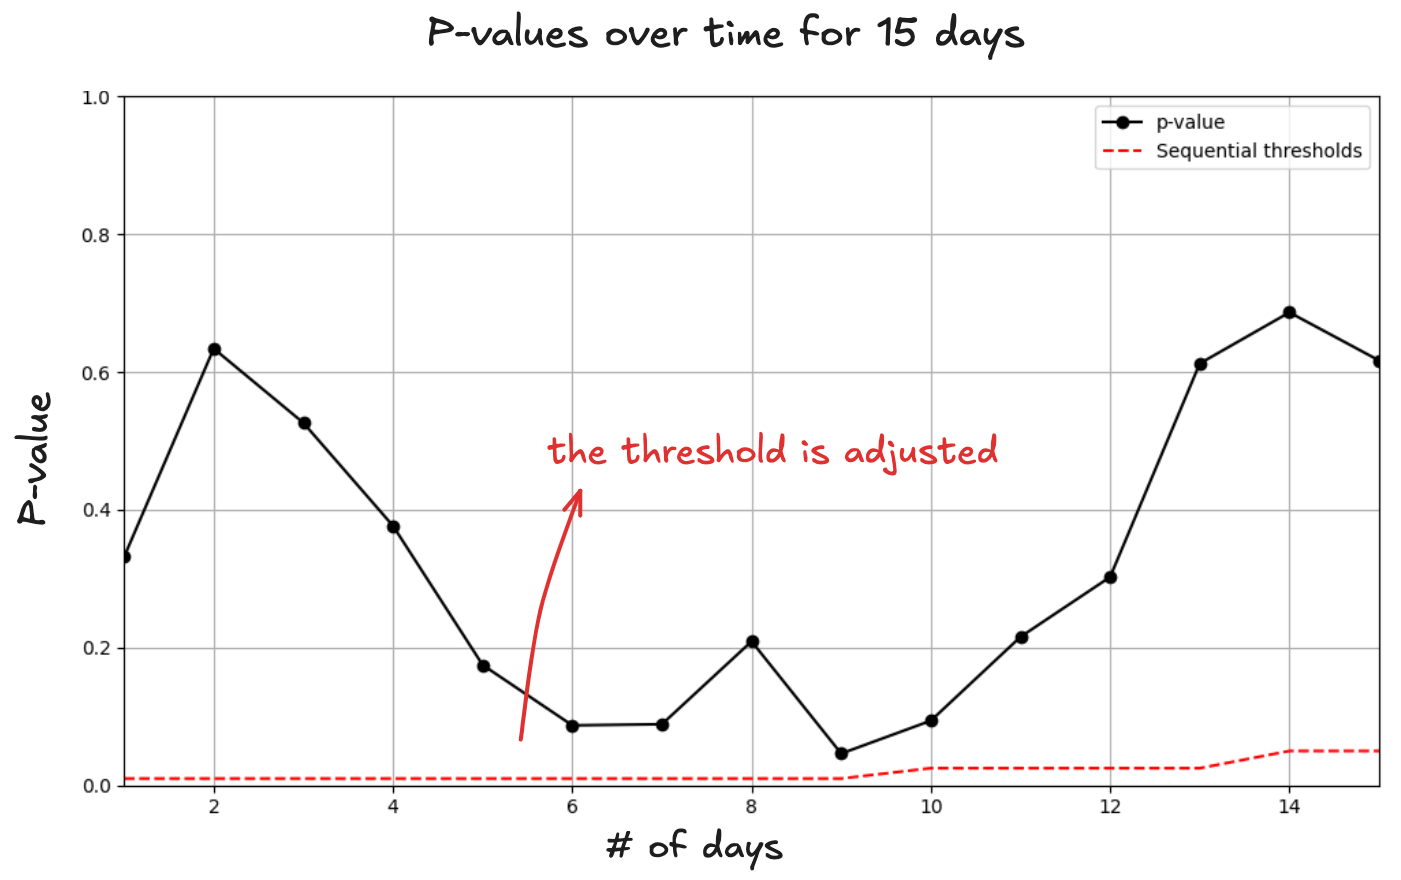
Let’s go back to our button test. You planned to collect data for 2 weeks. Instead of using a flat p<0.05p<0.05p<0.05 the whole time, sequential testing adjusts the threshold depending on when you stop:

  • Week 1: Only stop if p < 0.01 (super strict)
  • Day 10: Only stop if p < 0.025 (still strict)
  • Day 14: Normal p < 0.05 threshold

This approach controls the overall false positive rate, even if you peek multiple times.

Remember our day 9 result where p = 0.048? Under sequential testing, that wouldn't qualify. You'd need p < 0.01 to stop in week 1. So you'd keep running the test and probably discover it wasn't actually significant:

It works like "spending" your false positive budget gradually instead of all at once.

So yes, you can peek with discipline. But for most teams, the simpler and safer move is still the right one: wait the damn two weeks.


In summary

Your next experiment will be more reliable if you:

  • Pre-register hypotheses and metrics
  • Avoid digging through metrics post hoc
  • Use corrections when testing multiple variants
  • Apply proper thresholds if you peek early
  • Celebrate definitive negative results (might be controversial)

The irony is that better statistical practices actually accelerate learning. Instead of shipping noise and wondering why your metrics plateau, you'll build genuine understanding of what drives user behavior. That's worth slowing down for.


Read the original article

Comments

  • By kgwgk 2025-06-2210:414 reply

    > Setting a p-value threshold of 0.05 is equivalent to saying: "I’m willing to accept a 5% chance of shipping something that only looked good by chance."

    No, it means "I’m willing to ship something that if it was not better than the alternative it would have had only a 5% chance of looking as good as it did.”

    • By wavemode 2025-06-2212:518 reply

      Can you elaborate on the difference between your statement and the author's?

      • By sweezyjeezy 2025-06-2214:01

        This is a subtle point that even a lot of scientists don't understand. A p value or < 0.05 doesn't mean "there is less than a 5% chance the treatment is not effective". It means that "if the treatment was only as effective, (or worse) than the original, we'd have < 5% chance of seeing results this good". Note that in the second case we're making a weaker statement - it doesn't directly say anything about the particular experiment we ran and whether it was right or wrong with any probability, only about how extreme the final result was.

        Consider this example - we don't change the treatment at all, we just update its name. We split into two groups and run the same treatment on both, but under one of the two names at random. We get a p value of 0.2 that the new one is better. Is it reasonable to say that there's a >= 80% chance it really was better, knowing that it was literally the same treatment?

      • By datastoat 2025-06-2214:173 reply

        Author: "5% chance of shipping something that only looked good by chance". One philosophy of statistics says that the product either is better or isn't better, and that it's meaningless to attach a probability to facts, which the author seems to be doing with the phrase "5% chance of shipping something".

        Parent: "5% chance of looking as good as it did, if it were truly no better than the alternative." This accepts the premise that the product quality is a fact, and only uses probability to describe the (noisy / probabilistic) measurements, i.e. "5% chance of looking as good".

        Parent is right to pick up on this, if we're talking about a single product (or, in medicine, if we're talking about a single study evaluating a new treatment). But if we're talking about a workflow for evaluating many products, and we're prepared to consider a probability model that says some products are better than the alternative and others aren't, then the author's version is reasonable.

        • By pkhuong 2025-06-2215:12

          One easy slip-up with discussing p values in the context of a workflow or a decision-making process is that a process with p < 0.05 doesn't give us any bound on the actual ratio of actually good VS lucky changes. If we only consider good changes, the fraction of false positive changes is 0%; if we only consider bad changes, that fraction is 100%. Hypothesis testing is no replacement for insight or taste.

        • By kgwgk 2025-06-2216:031 reply

          > But if we're talking about a workflow for evaluating many products, and we're prepared to consider a probability model that says some products are better than the alternative and others aren't, then the author's version is reasonable.

          It’s not reasonable unless there is a real difference between those “many products” which is large enough to be sure that it would rarely be missed. That’s a quite strong assumption.

          • By jonahx 2025-06-2222:23

            This is the key point.

      • By kgwgk 2025-06-2215:401 reply

        There are a few good explanations already (also less good and very bad) so I give a simple example:

        You throw a coin five times and I predict the result correctly each time.

        #1 You say that I have precognition powers, because the probability that I don’t is less than 5%

        #2 You say that I have precognition powers, because if I didn’t the probability that I would have got the outcomes right is less than 5%

        #2 is a bad logical conclusion but it’s based on the right interpretation (while #1 is completely wrong): it’s more likely that I was lucky because precognition is very implausible to start with.

        • By jonahx 2025-06-2222:30

          Dead on again.

          What this and your other comment make clear is that once you start talking about the probability that X is true, especially in the context of hypothesis testing, you've moved (usually unwittingly) into a Bayesian framing, and you better make your priors explicit.

      • By productmanager 2025-06-2223:47

        I find it helpful to keep in mind that the traditional statistical significance test is a statement about a conditional probability. i.e. it's the probability of the data given the hypothesis (the null hypothesis). But what many actually want is the probability of the hypothesis given the data. Sometimes these are referred to as the frequentist vs. bayesian approach. There's a helpful recent podcast here by with author of Trustworthy Online Controlled Experiments https://music.youtube.com/podcast/hEzpiDuYFoE

      • By drc500free 2025-06-2215:28

        The wrong statement is saying P(no real effect) < 5%

        The correct statement is saying P(saw these results | no real effect) < 5%

        Consider two extremes, for the same 5% threshold:

        1) All of their ideas for experiments are idiotic. Every single experiment is for something that simply would never work in real life. 5% of those experiments pass the threshold and 0% of them are valid ideas.

        2) All of their ideas are brilliant. Every single experiment is for something that is a perfect way to capture user needs and get them to pay more money. 100% of those experiments pass the threshold and 100% of them are valid ideas.

        (P scores don't actually tell you how many VALID experiments will fail, so let's just say they all pass).

        This is so incredibly common in forensics that it's called the "prosecutor's fallacy."

      • By ghkbrew 2025-06-2213:59

        The chance that a positive result is a false positive depends on the false positive rate of your test and on total population statistics.

        E.g. imagine your test has a 5% false positive rate for a disease only 1 in 1 million people has. If you test 1 million people you expect 50,000 false positive and 1 true positive. So the chance that one of those positive results is a false positive is 50,000/50,001, not 5/100.

        Using a p-value threshold of 0.05 similar to saying: I'm going to use a test that will call a false result positive 5% of the time.

        The author said: chance that a positive result is a false positive == the false positive rate.

      • By leoff 2025-06-2217:08

        wrong: given that we got this result, what's the probability the null hypothesis is correct?

        correct: given that the null hypothesis is correct, what's the probability of us getting this result or more extreme ones by chance?

        from Bayes you know that P(A|B) and P(B|A) are 2 different things

      • By likecarter 2025-06-2213:391 reply

        Author: 5% chance it could be same or worse

        Parent: 5% chance it could be same

        • By esafak 2025-06-2214:171 reply

          @wavemode: In other words, the probability of it being the exactly the same is typically (for continuous random variables) zero, so we consider the tail probability; that of it being the same or more extreme.

          edit: Will the down voter please explain yourself? p-values are tail probabilities, and points have zero measure in continuous random variables.

    • By phaedrus441 2025-06-2211:42

      This! I see this all the time in medicine.

  • By Palmik 2025-06-227:342 reply

    This isn't just a startup thing. This is common also at FAANG.

    Not only are expriments commonly multi-arm, you also repeat your experiment (usually after making some changes) if the previous experiment failed / did not pass the launch criteria.

    This is further complicated by the fact that lauch criteria is usually not well defined ahead of time. Unless it's a complete slam dunk, you won't know until your launch meeting whether the experiment will be approved for launch or not. It's mostly vibe based, determined based on tens or hundreds of "relevant" metric movements, often decided on the whim of the stakeholder sitting at the lauch meeting.

    • By netcan 2025-06-2213:432 reply

      Is this terrible?

      The idea is not do do science. The idea is to loosely systematize and conceptualize innovation. To generate options and create a failure tolerant system.

      I'm sure improvements could be made... but this isn't about being a valid or invalid expirement.

      • By godelski 2025-06-2221:201 reply

          > The idea is not do do science. The idea is to loosely systematize and conceptualize innovation.
        
        Why are you acting like these are completely different frameworks? You have the same goals

        • By Rastonbury 2025-06-2319:39

          The standard for science a much higher ie. publishing a effect when it arose by chance as an academic

          When you A/B test generally mistakes are reversible and will not make your company bankrupt or lose your job. Something being a 1 in 20 fluke is acceptable risk, you'll get most decisions right. Compare this however to hairy decisions on entering a new market or creating a new product line, there are no A/B tests or scientific frameworks here, you gather all the evidence you can, estimate the risk and make a decision

      • By zeroCalories 2025-06-232:18

        It seems bad to me because you're giving yourself the illusion of effect.

    • By setgree 2025-06-2212:03

      You're describing conditioning analyses on data. Gelman and Loken (2013) put it like this:

      > The problem is there can be a large number of potential comparisons when the details of data analysis are highly contingent on data, without the researcher having to perform any conscious procedure of fishing or examining multiple p values. We discuss in the context of several examples of published papers where data-analysis decisions were theoretically-motivated based on previous literature, but where the details of data selection and analysis were not pre specified and, as a result, were contingent on data.

  • By simonw 2025-06-2123:573 reply

    On the one hand, this is a very nicely presented explanation of how to run statistically significant A/B style tests.

    It's worth emphasizing though that if your startup hasn't achieved product market fit yet this kind of thing is a huge waste of time! Build features, see if people use them.

    • By noodletheworld 2025-06-220:401 reply

      “This kind of thing” being running AB tests at all.

      There’s no reason to run AB / MVT tests at all if you’re not doing them properly.

      • By killerstorm 2025-06-2221:17

        Proper way to make decisions is Bayesian. Take into account every bit of evidence, all the time.

        Statistical hypothesis testing is a simplification for people who don't understand Bayesian approach.

    • By cdavid 2025-06-228:311 reply

      A/B testing does not have to involve micro optimization. If done well, it can reduce the risk / cost of trying things. For example, you can A/B test something before investing a full prod development, etc. When pushing for some ML-based improvements (e.g. new ranking algo), you also want to use it.

      This is why the cover of the reference A/B test book for product dev has a hippo: A/B test is helpful against just following the HIghest Paid Person Opinion. The practice is ofc more complicated, but that's more organizational/politics.

      • By simonw 2025-06-2213:341 reply

        In my own career I've only ever seen it increase the cost of development.

        The vast majority of A/B test results I've seen showed no significant win in one direction or the other, in which case why did we just add six weeks of delay and twice the development work to the feature?

        Usually it was because the Highest Paid Person insisted on an A/B test because they weren't confident enough to move on without that safety blanket.

        There are other, much cheaper things you can do to de-risk a new feature. Build a quick prototype and run a usability test with 2-3 participants - you get more information for a fraction of the time and cost of an A/B test.

        • By cdavid 2025-06-2215:581 reply

          There are cases where A/B testing does not make sense (not enough users to measure anything sensible, etc.). But if the A/B test results were inconclusive, assuming they were done correctly, then what was the point of launching the underlying feature ?

          As for the HIPPO pushing for an A/B test because of lack of confidence, all I can say is that we had very different experiences, because I've almost always seen the opposite, be it in marketing, search/recommendation, etc.

HackerNews