
I spent a month repeatedly building my website in Docker, and now have horrors to share. I've got a problem. My website (the one you're reading right now) is mainly served by a single Rust binary. For…
I spent a month repeatedly building my website in Docker, and now have horrors to share.
I've got a problem.
My website (the one you're reading right now) is mainly served by a single Rust binary. For far too long now, every time I wanted to make a change, I would:
- Build a new statically linked binary (with
--target=x86_64-unknown-linux-musl) - Copy it to my server
- Restart the website
This is... not ideal.
So instead, I'd like to switch to deploying my website with containers (be it Docker, Kubernetes, or otherwise), matching the vast majority of software deployed any time in the last decade.
The only issue is that fast Rust builds with Docker are not simple.
Update (2025-06-27)
I first posted this on Bluesky — there was some good discussion there ❤️
Special thanks to Piotr Osiewicz & Wesley Moore for suggestions that saved a ton more time.
More on those closer to the end.
It was also reposted over on r/rust, r/programming and hackernews. Plenty of entertaining comments, if you're in the mood.
Table of Contents:
To get your Rust program in a container, the typical approach you might find would be something like:
FROM rust:1.87-alpine3.22 AS builder RUN apk add musl-dev WORKDIR /workdir
COPY . . RUN cargo build --package web-http-server --target=x86_64-unknown-linux-musl FROM alpine:3.20
COPY /workdir/target/x86_64-unknown-linux-musl/release/web-http-server /usr/bin/web-http-server ENTRYPOINT ["/usr/bin/web-http-server"]
Unfortunately, this will rebuild everything from scratch whenever there's any change.
In my case, building from scratch takes about 4 minutes (including 10s to download the crates every time).
$ cargo build --release --target=x86_64-unknown-linux-musl --package web-http-server
 Updating crates.io index Downloading crates ... Downloaded anstream v0.6.18 Downloaded http-body v1.0.1 ... many more lines ... Compiling web-http-server v0.1.0 (/workdir/web-http-server) Finished `release` profile [optimized + debuginfo] target(s) in 3m 51s
Sure, it could be worse. But I've grown accustomed to speedy local builds, thanks to incremental compilation — I don't want to wait that long on every tiny change!
Thankfully, there's a tool to help with this!
Luca Palmieri's cargo-chef makes it easy to pre-build all of the dependencies as a separate layer in the docker
build cache, so that changes in your codebase only trigger re-compilation of your codebase (and not your dependencies).
I'll save the detailed explanation for Luca's blog post, but broadly cargo-chef creates a simplified "recipe" file from
the current workspace, which can be "cooked" to cache the dependencies without being invalidated by changes in the
workspace.
My website pulls in a few hundred dependencies, so this should help!
... FROM ... AS planner
COPY . .
RUN cargo chef prepare --recipe-path=/workdir/recipe.json FROM ... AS cooker COPY /workdir/recipe.json recipe.json
RUN cargo chef cook --release --recipe-path=/workdir/recipe.json \ --target=x86_64-unknown-linux-musl FROM cooker AS builder
COPY . .
RUN cargo build --release --package web-http-server \ --target=x86_64-unknown-linux-musl
Unfortunately though, it doesn't have quite the speedup we're looking for — most of the time is still in the final binary:
$
$ cargo chef cook --release ...
 Updating crates.io index Downloading crates ... ... Compiling web-http-server v0.0.1 (/workdir/web-http-server) Finished `release` profile [optimized + debuginfo] target(s) in 1m 07s $
$ cargo build --release ...
 Compiling web-http-server v0.1.0 (/workdir/web-http-server) Finished `release` profile [optimized + debuginfo] target(s) in 2m 50s
Weirdly, only 25% of the time is actually spent on the dependencies! As far as I could tell, my code isn't doing
anything fundamentally unreasonable. It's ~7k lines of gluing together various larger dependencies (axum, reqwest,
tokio-postgres, among others.)
(Just to double-check, I tried running cargo build with --verbose. It really was just a single
invocation of rustc that took almost 3 minutes!)
Following this excellent post by fasterthanlime, I first tried using cargo --timings to get some more information:
$ cargo build --release --timings ...
 Compiling web-http-server v0.1.0 (/workdir/web-http-server) Timing report saved to /workdir/target/cargo-timings/cargo-timing-20250607T192029.207407545Z.html Finished `release` profile [optimized + debuginfo] target(s) in 2m 54s
In addition to that cargo-timing-<timestamp>.html file, there's also a cargo-timing.html. We'll
just copy out the canonical version:
... FROM cooker AS builder
COPY . .
RUN cargo build --timings --release --target=x86_64-unknown-linux-musl --package web-http-server RUN mv target/cargo-timings/cargo-timing-*.html cargo-timing.html FROM alpine:3.22
COPY /workdir/target/x86_64-unknown-linux-musl/release/web-http-server /usr/bin/web-http-server COPY /workdir/cargo-timing.html cargo-timing.html
And with a little bit of container wrangling...
id="$(docker container create <IMAGE>)"
docker cp "$id:/cargo-timing.html" cargo-timing.html
docker container rm -f "$id"
... we should be able to see what's going on! Let's have a look:
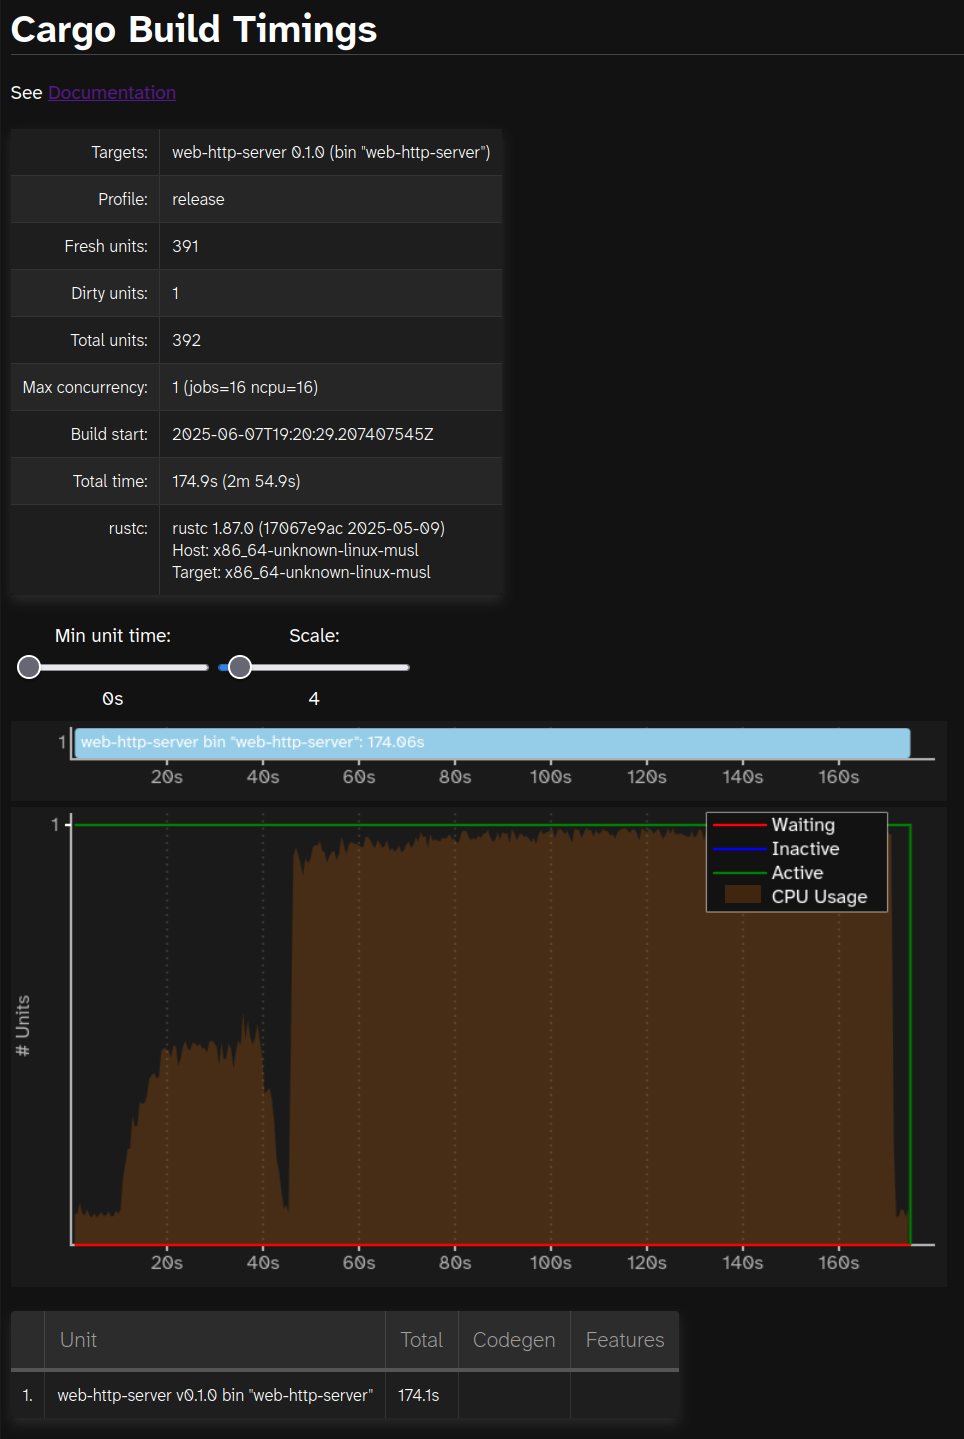
Oh. There's not really much information there!
cargo build --timings shows a bunch of information about how long each crate took to compile. But here, we only care
about the compilation time of the final crate!
That aside, this does help give us more accurate timing. Measuring outside the compiler adds some extra moving
pieces, or requires searching the output of cargo build — so using cargo's self-reported timings will make more
precise analysis a bit easier, later on.
Just to check, the value here of 174.1s roughly matches the "2m 54s" we saw from the cargo build output.
The post from fasterthanlime had one more tip we can use — rustc's self-profiling feature, via the -Zself-profile
flag.
Normally, you'd probably run something like:
RUSTC_BOOTSTRAP=1 cargo rustc --release -- -Z self-profile
(note: This is using cargo rustc to pass extra flags to rustc, with RUSTC_BOOTSTRAP=1 to allow using the -Z
unstable flags on a stable compiler.)
Unfortunately, this won't work here — the change in arguments will invalidate the cached dependencies from
cargo chef cook, and there's no equivalent way to pass additional rustc flags through cargo-chef.
Instead, we can funnel everything via the RUSTFLAGS environment variable:
RUSTC_BOOTSTRAP=1 RUSTFLAGS='-Zself-profile' cargo chef cook --release ... RUSTC_BOOTSTRAP=1 RUSTFLAGS='-Zself-profile' cargo build --release ...
This gives us files like web_http_server-<random-number>.mm_profdata, which we can move and extract from the image in
the same way as we did for cargo-timing.html.
(note: It's much easier to automate if we remove the profiling data that was added from cargo chef cook before the
final build. That's omitted here, for brevity.)
The Rust folks maintain a suite of tools for exploring rustc's self-profiling output, over in
https://github.com/rust-lang/measureme.
Some key ones:
summary– produces plaintext output summarizing the profiling dataflamegraph– produces a flamegraph SVGcrox– produces a chrome tracing format trace, compatible withchrome://tracing(in Chromium-based browsers)
But let's install a couple of these to take a look at what we've got:
cargo install --git https://github.com/rust-lang/measureme flamegraph summarize
I personally use Firefox, so we'll hold off on the chrome tracing stuff for now.
First, with summarize (which itself has the summarize and diff subcommands):
$ summarize summarize web_http_server.mm_profdata | wc -l
945
$ summarize summarize web_http_server.mm_profdata | head
+-------------------------------+-----------+-----------------+----------+------------+
| Item | Self time | % of total time | Time | Item count |
+-------------------------------+-----------+-----------------+----------+------------+
| LLVM_lto_optimize | 851.95s | 33.389 | 851.95s | 1137 |
+-------------------------------+-----------+-----------------+----------+------------+
| LLVM_module_codegen_emit_obj | 674.94s | 26.452 | 674.94s | 1137 |
+-------------------------------+-----------+-----------------+----------+------------+
| LLVM_thin_lto_import | 317.75s | 12.453 | 317.75s | 1137 |
+-------------------------------+-----------+-----------------+----------+------------+
| LLVM_module_optimize | 189.00s | 7.407 | 189.00s | 17 | thread 'main' panicked at library/std/src/io/stdio.rs:1165:9:
failed printing to stdout: Broken pipe (os error 32)
note: run with `RUST_BACKTRACE=1` environment variable to display a backtrace
(Oops! Classic CLI edge-case. Easy enough to fix, though 😊)
So at a high level, the two biggest things are link-time optimization (LTO) and
LLVM_module_codegen_emit_obj, whatever that is.
Let's see if we can dig a bit deeper with the flamegraph:
$ flamegraph web_http_server.mm_profdata
$
$ find . -cmin 1 -type f
./rustc.svg
Cool, we get an SVG!

(It's interactive! If you're curious, you can click through and play around with it yourself.)
So there's presumably some inter-mingling going on between codegen and LTO: codegen_module_perform_lto ends up falling
through to both LLVM_lto_optimize/LLVM_thin_lto_import and LLVM_module_codegen.
But either way, we've got a problem with LTO: codegen_module_perform_lto took ~80% of the total time.
The Rust compiler splits up crates into "codegen units", handing each to LLVM as a separate module to compile. In general, optimizations take place within each codegen unit, and then they're linked together at the end.
LTO controls the set of optimizations that LLVM will make during that link-time — for example, inlining or optimization across codegen units.
Cargo (via rustc) exposes a few options for LTO:
- Off — all LTO disabled
- "thin" LTO — in theory, similar performance benefits to "fat" LTO, but less expensive to run
- "fat" LTO — maximum amount of LTO, across all crates at the same time
And if the LTO option is not specified, rustc uses "thin local LTO", which limits "thin" LTO only to a single crate at
a time.
Turns out that a few years back, I had set lto = "thin" in my Cargo.toml:
[profile.release]
lto = "thin"
debug = "full"
And, while we're at it, debug = "full" enables all debug symbols (where they'd normally be excluded by default for the
release profile). Maybe we should take a look at that as well.
Let's take a look at the compile times and binary sizes for a variety of lto and debug settings (using
cargo build --timings like before, for more precise timing).
| Time / Size | debug=none | debug=line-tables-only | debug=limited | debug=full |
|---|---|---|---|---|
| LTO disabled | 50.0s / 21.0Mi | 54.4s / 85.9Mi | 54.8s / 105.9Mi | 67.6s / 214.3Mi |
| Thin local LTO | 67.5s / 20.1Mi | 71.5s / 95.4Mi | 73.6s / 117.0Mi | 88.2s / 256.8Mi |
| "Thin" LTO | 133.7s / 20.3Mi | 141.7s / 80.6Mi | 140.7s / 96.0Mi | 172.2s / 197.5Mi |
| "Fat" LTO | 189.1s / 15.9Mi | 211.1s / 64.4Mi | 212.5s / 75.8Mi | 287.1s / 155.9Mi |
At a high level: It seems like the worst cases here are full debug symbols adding 30-50% to the compilation time, and "fat" LTO taking about 4 times longer than with LTO fully disabled.
That mostly tracks with what we'd expect from the documentation — yeah, fat LTO takes longer. But when we disable everything, we're still looking at 50 seconds compiling the final binary!
Look, 50 seconds is already a great improvement — and if it requires disabling LTO and debug symbols... my website gets approximately zero load. It would be totally fine. It would be perfectly sustainable, even!
There's no practical reason to keep digging here.
But where's the fun in leaving it there? We should be able to do better, right?
It's slightly more complicated, but yes, absolutely — for local development, at least. Consistently loading the build
cache isn't straightforward, but you'd want to make the /target directory accessible with a "cache mount" in the
dockerfile, and persist that target directory between builds.
That said, I value that docker build can have a clean environment every time, and I think it's worthwhile to go
through docker's own caching system — which is why I'm using cargo-chef in the first place.
If we disable LTO and debug symbols, compiling the final binary still takes 50 seconds to do... something.
Let's re-run the self-profiling to check out what's going on.

It's ~70% just LLVM_module_optimize — i.e. where LLVM is optimizing the code. Before diving into LLVM itself, let's
see if there's any easier knobs we can tune.
The release profile uses opt-level = 3 by default — maybe if we reduce the optimization level, we'll spend less
time on it.
We can actually do one better — since our dependencies are cached, and we only care about the final binary, we can get most of the benefits by only reducing optimizations on the final binary:
[profile.release]
lto = "off"
debug = "none"
opt-level = 0 [profile.release.package."*"]
opt-level = 3
Like the previous options, there's a handful of opt-levels we can choose from:
0disables optimizations1,2, and3enable increasing levels of optimizations"s"and"z"are different flavors of prioritizing binary size
Going through a handful of combinations here again:
| Final / Deps | deps: opt-level=3 | deps: opt-level="s" | deps: opt-level="z" |
|---|---|---|---|
final: opt-level=0 | 14.7s / 26.0Mi | 15.0s / 25.9Mi | 15.7s / 26.3Mi |
final: opt-level=1 | 48.8s / 21.5Mi | 47.6s / 20.1Mi | 47.8s / 20.6Mi |
final: opt-level=2 | 50.8s / 20.9Mi | 55.2s / 20.2Mi | 55.4s / 20.7Mi |
final: opt-level=3 | 51.0s / 21.0Mi | 55.4s / 20.3Mi | 55.2s / 20.8Mi |
final: opt-level="s" | 46.0s / 20.1Mi | 45.7s / 18.9Mi | 46.0s / 19.3Mi |
final: opt-level="z" | 42.7s / 20.1Mi | 41.8s / 18.8Mi | 41.8s / 19.3Mi |
Basically:
- The baseline for any level of optimizations on the final binary is about 50 seconds
- If we disable all optimizations, then it's pretty quick: only ~15s
Rust relies pretty heavily on optimizations, and while it'd probably be fine to just blanket-disable them for the final binary, it'd be pretty cool if we can at least keep some optimizations!
So let's try to figure out what's taking so long. rustc's self-profiling doesn't give us any more detail though,
so we'll have to get it from LLVM.
There's another couple useful rustc flags here:
-Z time-llvm-passes– emit LLVM profiling information as plaintext-Z llvm-time-trace– emit LLVM profiling information in the chrome tracing format (again with that one!)
Like before, let's skip the chrome tracing format for now, and see what we can get from plain text.
RUSTC_BOOTSTRAP=1 RUSTFLAGS='-Ztime-llvm-passes' cargo chef cook --release ... RUSTC_BOOTSTRAP=1 RUSTFLAGS='-Ztime-llvm-passes' cargo build --release ...
... Unfortunately if you try to docker build again, you'll immediately hit something like:
[output clipped, log limit 2MiB reached]
This is because BuildKit (if you're using ~recent Docker on Linux) has default output limits that are pretty small.
We can just raise the limits, right?
These limits are configured by the environment variables BUILDKIT_STEP_LOG_MAX_SIZE and BUILDKTI_STEP_LOG_MAX_SPEED.
But if we pass them to docker build with something like this:
BUILDKIT_STEP_LOG_MAX_SIZE=-1 BUILDKTI_STEP_LOG_MAX_SPEED=-1 docker build ...
... it won't work, because the configuration must be set on the docker daemon.
On most Linux distros, dockerd is run as a systemd unit.
So just set it on the systemd unit?
The Proper™ way to do this is by creating an override file – something like:
$ systemctl edit --drop-in=buildkit-env.conf docker.service
(note: passing --drop-in allows naming the file something more descriptive than override.conf)
It opens a new file, where we can set the environment overrides:
[Service]
Environment="BUILDKIT_STEP_LOG_MAX_SIZE=-1"
Environment="BUILDKIT_STEP_LOG_MAX_SPEED=-1"
And once we're done:
$ systemctl restart docker.service
Checking our work...
After restarting, we can double-check the environment with something like:
$ pgrep dockerd
1234567
$ cat /proc/1234567/environ | tr '\0' '\n' | grep -i 'buildkit'
BUILDKIT_STEP_LOG_MAX_SIZE=-1
BUILDKIT_STEP_LOG_MAX_SPEED=-1
(note: tr is needed because the environment is a nul-separated string, and it's easier to search line-by-line)
So after getting unlimited docker build output on the terminal, what's in it?
~200k lines of plaintext — probably not what you want to be copying from your terminal, anyways.
So, redirecting to a file inside docker and copying that out like before, we get a bunch of pass/analysis timing reports. They each look something like this:
===-------------------------------------------------------------------------===
                          Pass execution timing report
===-------------------------------------------------------------------------===
  Total Execution Time: 0.0428 seconds (0.0433 wall clock)

   ---User Time---   --System Time--   --User+System--   ---Wall Time---  — Name ---
   0.0072 ( 19.2%)   0.0015 ( 27.4%)   0.0086 ( 20.2%)   0.0087 ( 20.0%)  InstCombinePass
   0.0040 ( 10.8%)   0.0006 ( 10.8%)   0.0046 ( 10.8%)   0.0047 ( 10.8%)  InlinerPass
   0.0024 (  6.4%)   0.0010 ( 18.0%)   0.0034 (  7.9%)   0.0034 (  7.8%)  SimplifyCFGPass
   0.0022 (  5.9%)   0.0002 (  4.5%)   0.0025 (  5.7%)   0.0024 (  5.6%)  EarlyCSEPass
   0.0021 (  5.5%)   0.0001 (  1.5%)   0.0021 (  5.0%)   0.0022 (  5.0%)  GVNPass
   0.0015 (  4.0%)   0.0001 (  2.2%)   0.0016 (  3.8%)   0.0018 (  4.2%)  ArgumentPromotionPass

   ... entries here continue, and more passes below, for hundreds of thousands of lines ...
It certainly is possible to parse and analyze these! But it's also hard to be certain about what you're looking at when each pass execution is emitted separately and multi-threading can interfere with timing.
Let's see if there's a better way to get good data.
We skipped -Z llvm-time-trace earlier because it emits the chrome tracing format.
Let's revisit that:
RUSTC_BOOTSTRAP=1 RUSTFLAGS='-Zllvm-time-trace' cargo chef cook --release ... RUSTC_BOOTSTRAP=1 RUSTFLAGS='-Zllvm-time-trace' cargo build --release ...
It produces a bunch of $package-$hash.llvm_timings.json files, alongside the normal compilation artifacts:
$ ls -lAh target/x86_64-unknown-linux-musl/release/deps | head
total 5G
-rw-r--r-- 1 root root 11.8K Jun 9 23:11 aho_corasick-ff268aeac1b7a243.d
-rw-r--r-- 1 root root 69.4M Jun 9 23:11 aho_corasick-ff268aeac1b7a243.llvm_timings.json
-rw-r--r-- 1 root root 6.6K Jun 9 23:11 allocator_api2-28ed2e0fa8ab7b44.d
-rw-r--r-- 1 root root 373.1K Jun 9 23:11 allocator_api2-28ed2e0fa8ab7b44.llvm_timings.json
-rw-r--r-- 1 root root 4.0K Jun 9 23:11 anstream-cf9519a72988d4c1.d
-rw-r--r-- 1 root root 4.4M Jun 9 23:11 anstream-cf9519a72988d4c1.llvm_timings.json
-rw-r--r-- 1 root root 2.4K Jun 9 23:11 anstyle-76a77f68346b4238.d
-rw-r--r-- 1 root root 885.3K Jun 9 23:11 anstyle-76a77f68346b4238.llvm_timings.json
-rw-r--r-- 1 root root 2.2K Jun 9 23:11 anstyle_parse-702e2f8f76fe1827.d
(Why root? Setting up rootless docker didn't work when I tried it a few years back, and I haven't bothered since)
So, deleting *.llvm_timings.json between cargo-chef and the final build, we can extract the singular profile for the
final binary into web_http_server.llvm_timings.json.
There's just one minor hiccup:
$ du -sh web_http_server.llvm_timings.json
1.4G	web_http_server.llvm_timings.json
It's enormous. It's also all one single line!
In theory though, a wide variety of tools should be able to process this:
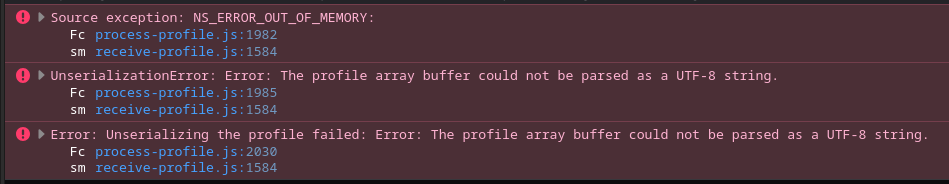
Firefox profiling
I'm using Firefox, so why not Firefox Profiler? It should be able to handle it:
The Firefox Profiler can also import profiles from other profilers, such as Linux perf, Android SimplePerf, the Chrome performance panel, Android Studio, or any file using the dhat format or Google’s Trace Event Format.
Unfortunately, this didn't work:

Looking at the web console, we can see why it failed – it ran out of memory:
perfetto.dev on Firefox
When I searched for displaying these chrome tracing format traces, perfetto.dev was another alternative that came up. It's also maintained by Google.
When I first tried it, I was using a larger trace from a longer compilation, and it ran out of memory as well:

I resorted to running the WASM processor locally, hitting this bug affecting Firefox.
At the time I gave up and used Chromium instead, but in the process of writing this post, I tried it again. The smaller trace allowed it to work:
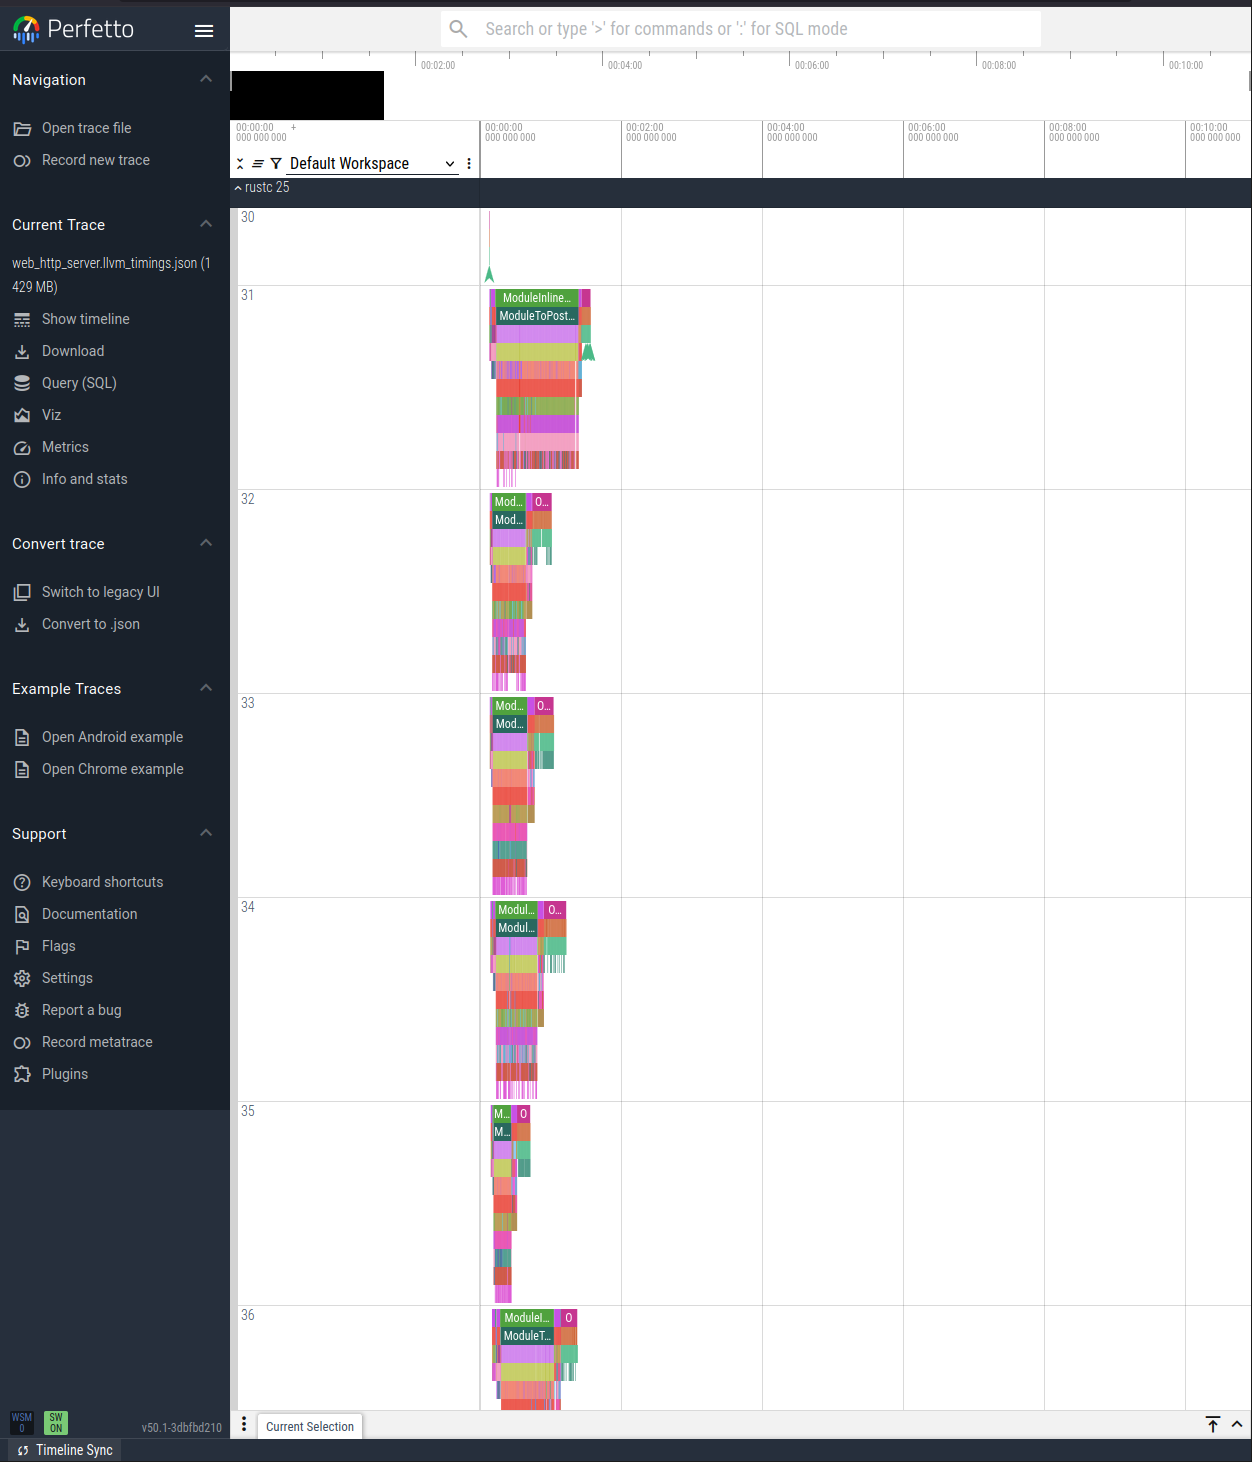
Either way though, I found I had absolutely no clue how to use this interface – and loading a complex trace from LLVM probably also wasn't the best introduction point.
chrome://tracing on Chromium
You'd be forgiven for expecting this one to work the best out of all the options, but unfortunately it also failed – albeit more amusingly than the others:

None of these options worked for me — but it's a big JSON file with a known format, how hard can it be?
Turns out, a 1.4GiB single line of JSON makes all the normal tools complain:
- If you try to view it with
less, scrolling blocks on processing the entire file - If you try to process it with
jq, it has to load the entire 1.4GiB intojq's internal format (which expectedly takes up much more than the original 1.4GiB) - Vim hangs when you open it
- And you probably don't want to just
catit to the terminal — again, it's 1.4GiB!
So instead, we can just look at a few hundred characters, at the start and end of the file:
$ head -c300 web_http_server.llvm_timings.json
{"traceEvents":[{"pid":25,"tid":30,"ts":8291351,"ph":"X","dur":6827,"name":"RunPass","args":{"detail":"Expand large div/rem"}},{"pid":25,"tid":30,"ts":8298181,"ph":"X","dur":2,"name":"RunPass","args":{"detail":"Expand large fp convert"}},{"pid":25,"tid":30,"ts":8298183,"ph":"X","dur":8,"name":"RunPa
$ tail -c300 web_http_server.llvm_timings.json
me":""}},{"cat":"","pid":25,"tid":43,"ts":0,"ph":"M","name":"thread_name","args":{"name":""}},{"cat":"","pid":25,"tid":44,"ts":0,"ph":"M","name":"thread_name","args":{"name":""}},{"cat":"","pid":25,"tid":29,"ts":0,"ph":"M","name":"thread_name","args":{"name":""}}],"beginningOfTime":1749510885820760}
Matching this to the "JSON Object Format" from the chrome tracing spec, it seems we have a single JSON object like:
{ "traceEvents": [ {"pid":25,"tid":30,"ts":8291351,"ph":"X","dur":6827,"name":"RunPass","args":{"detail":"Expand large div/rem"}}, {"pid":25,"tid":30,"ts":8298181,"ph":"X","dur":2,"name":"RunPass","args":{"detail":"Expand large fp convert"}}, ... ], "beginningOfTime": 1749510885820760
}
We'd be able to process it with normal tools if we split each event into its own object. That could be something like:
cat web_http_server.llvm_timings.json \ | sed -E 's/},/}\n/g;s/^\{"traceEvents":\[//g;s/\],"beginningOfTime":[0-9]+}$//g' \ > web-http-server.llvm_timings.jsonl
(i.e.: turn }, into a newline, strip the start of the object, strip the end of the object)
And now we can process this.
$ wc -l web_http_server.llvm_timings.jsonl
7301865 web_http_server.llvm_timings.jsonl $ head web_http_server.llvm_timings.jsonl
{"pid":25,"tid":30,"ts":8291351,"ph":"X","dur":6827,"name":"RunPass","args":{"detail":"Expand large div/rem"}}
{"pid":25,"tid":30,"ts":8298181,"ph":"X","dur":2,"name":"RunPass","args":{"detail":"Expand large fp convert"}}
{"pid":25,"tid":30,"ts":8298183,"ph":"X","dur":8,"name":"RunPass","args":{"detail":"Expand Atomic instructions"}}
{"pid":25,"tid":30,"ts":8298192,"ph":"X","dur":0,"name":"RunPass","args":{"detail":"Lower AMX intrinsics"}}
{"pid":25,"tid":30,"ts":8298193,"ph":"X","dur":0,"name":"RunPass","args":{"detail":"Lower AMX type for load/store"}}
{"pid":25,"tid":30,"ts":8298195,"ph":"X","dur":1,"name":"RunPass","args":{"detail":"Lower Garbage Collection Instructions"}}
{"pid":25,"tid":30,"ts":8298196,"ph":"X","dur":1,"name":"RunPass","args":{"detail":"Shadow Stack GC Lowering"}}
{"pid":25,"tid":30,"ts":8298197,"ph":"X","dur":1164,"name":"RunPass","args":{"detail":"Remove unreachable blocks from the CFG"}}
{"pid":25,"tid":30,"ts":8299362,"ph":"X","dur":1,"name":"RunPass","args":{"detail":"Instrument function entry/exit with calls to e.g. mcount() (post inlining)"}}
{"pid":25,"tid":30,"ts":8299363,"ph":"X","dur":5,"name":"RunPass","args":{"detail":"Scalarize Masked Memory Intrinsics"}}
It looks like these events all have "ph":"X".
According to the spec, the ph field gives the type of event, and X refers to "complete" events, recording how long a
particular piece of work took on a given thread (tid). The duration in microseconds is given by dur.
Aside from that, we also have M events:
$ cat web_http_server.llvm_timings.jsonl | jq -c 'select(.ph != "X")' | head
{"cat":"","pid":25,"tid":27,"ts":0,"ph":"M","name":"process_name","args":{"name":"rustc"}}
{"cat":"","pid":25,"tid":27,"ts":0,"ph":"M","name":"thread_name","args":{"name":""}}
{"cat":"","pid":25,"tid":30,"ts":0,"ph":"M","name":"thread_name","args":{"name":""}}
{"cat":"","pid":25,"tid":35,"ts":0,"ph":"M","name":"thread_name","args":{"name":""}}
{"cat":"","pid":25,"tid":32,"ts":0,"ph":"M","name":"thread_name","args":{"name":""}}
{"cat":"","pid":25,"tid":33,"ts":0,"ph":"M","name":"thread_name","args":{"name":""}}
{"cat":"","pid":25,"tid":34,"ts":0,"ph":"M","name":"thread_name","args":{"name":""}}
{"cat":"","pid":25,"tid":39,"ts":0,"ph":"M","name":"thread_name","args":{"name":""}}
{"cat":"","pid":25,"tid":40,"ts":0,"ph":"M","name":"thread_name","args":{"name":""}}
{"cat":"","pid":25,"tid":36,"ts":0,"ph":"M","name":"thread_name","args":{"name":""}}
These are "metadata" events — in our case, not much useful information.
And aside from these, there's nothing else:
$ cat web_http_server.llvm_timings.jsonl | jq -c 'select(.ph != "X" and .ph != "M")'
<nothing>
Going back to those X events — there were a bunch of them with "name":"RunPass". What else do we have?
$ cat web_http_server.llvm_timings.jsonl | jq -c 'select(.ph == "X" and .name != "RunPass")' | head
{"pid":25,"tid":30,"ts":8291349,"ph":"X","dur":32009,"name":"OptFunction","args":{"detail":"_RNvCscSpY9Juk0HT_7___rustc12___rust_alloc"}}
{"pid":25,"tid":30,"ts":8323394,"ph":"X","dur":283,"name":"OptFunction","args":{"detail":"_RNvCscSpY9Juk0HT_7___rustc14___rust_dealloc"}}
{"pid":25,"tid":30,"ts":8323678,"ph":"X","dur":216,"name":"OptFunction","args":{"detail":"_RNvCscSpY9Juk0HT_7___rustc14___rust_realloc"}}
{"pid":25,"tid":30,"ts":8323895,"ph":"X","dur":179,"name":"OptFunction","args":{"detail":"_RNvCscSpY9Juk0HT_7___rustc19___rust_alloc_zeroed"}}
{"pid":25,"tid":30,"ts":8324075,"ph":"X","dur":155,"name":"OptFunction","args":{"detail":"_RNvCscSpY9Juk0HT_7___rustc26___rust_alloc_error_handler"}}
{"pid":25,"tid":30,"ts":8288691,"ph":"X","dur":35693,"name":"OptModule","args":{"detail":"5z12fn0vr5uv0i2pfsngwe5em"}}
{"pid":25,"tid":35,"ts":9730144,"ph":"X","dur":16,"name":"Annotation2MetadataPass","args":{"detail":"[module]"}}
{"pid":25,"tid":35,"ts":9730214,"ph":"X","dur":10,"name":"ForceFunctionAttrsPass","args":{"detail":"[module]"}}
{"pid":25,"tid":35,"ts":9730346,"ph":"X","dur":11,"name":"InnerAnalysisManagerProxy<llvm::AnalysisManager<llvm::Function>, llvm::Module>","args":{"detail":"[module]"}}
{"pid":25,"tid":35,"ts":9730416,"ph":"X","dur":17,"name":"TargetLibraryAnalysis","args":{"detail":"llvm.expect.i1"}}
Neat! It looks like we might be able to demangle some of the symbols to get timings on individual functions.
If we track what's being run and how long it takes, we should be able to get a better sense of why our compile time is so long.
Later on, there's aggregate information for certain types of events, like Total OptFunction. These are equivalent to
the sum of the duration for that event type (in this case, OptFunction). Let's see kind of operations are taking the
most time:
$ cat web_http_server.llvm_timings.jsonl | jq -r 'select(.name | startswith("Total ")) | "\(.dur / 1e6) \(.name)"' | sort -rn | head
665.369662 Total ModuleInlinerWrapperPass
656.465446 Total ModuleToPostOrderCGSCCPassAdaptor
632.441396 Total DevirtSCCRepeatedPass
627.236893 Total PassManager<llvm::LazyCallGraph::SCC, llvm::AnalysisManager<llvm::LazyCallGraph::SCC, llvm::LazyCallGraph&>, llvm::LazyCallGraph&, llvm::CGSCCUpdateResult&>
536.738589 Total PassManager<llvm::Function>
372.768547 Total CGSCCToFunctionPassAdaptor
193.914869 Total ModuleToFunctionPassAdaptor
190.924012 Total OptModule
189.621119 Total OptFunction
182.250077 Total InlinerPass
This particular run took ~110 seconds on a 16-core machine, so it's clear that some passes are being double-counted
(which makes sense — we see both ModuleInlinerWrapperPass and InlinerPass, and it looks like OptModule
probably just calls OptFunction).
But broadly, it seems like optimization (OptFunction) and inlining (InlinerPass) are the two parts taking a lot of
time — let's see if we can do anything about it.
Hopefully, yes!
LLVM has a bunch of arguments that can be configured, which rustc exposes through the -C llvm-args flag. At time of
writing (June 2025), there's somewhere in the region of ~100 options that mention inlining (via rustc -C llvm-args='--help-list-hidden').
In particular, there's a bunch of relevant options in the file controlling the cost analysis.
Now, I'll be honest, I know very little about LLVM's inlining. Most of the options refer to the "cost" associated with the inlining, or with the function being inlined, etc. I'm flying mostly bind here. But there's a few arguments that seem like decent candidates for tuning:
--inlinedefault-threshold=225— "Default amount of inlining to perform"--inline-threshold=225— "Control the amount of inlining to perform"--inlinehint-threshold=325— "Threshold for inlining functions with inline hint"
For all of these, the "threshold" roughly means "allow inlining functions with cost below the threshold", so a higher threshold means more inlining.
So if we set all of these to some value (e.g., 50), we should see that there's less inlining, and in turn faster
compile times.
Something like:
RUSTFLAGS="-Cllvm-args=-inline-threshold=50 -Cllvm-args=-inlinedefault-threshold=50 -Cllvm-args=-inlinehint-threshold=50" ...
(Why separate -C llvm-args? I couldn't find a way to make the whitespace happy through the RUSTFLAGS environment
variable — maybe it's possible if you set build.rustflags in .cargo/config.toml, but this solution worked 🤷)
In any case, reducing to a threshold of 50 does end up faster! About 42.2s, down from 48.8s.
Here's what that looks like across a handful of values:

(note: The smallest value is 1, and not zero. Why 1? Sometimes zero has special behavior – setting to one seemed like a safer bet.)
Of these, it's hard to say exactly what the best value is, but for my use case (remember: my website gets ~zero load!), setting the thresholds to 10 looks promising. We'll hold off on that for now though.
Optimizing functions was the other expensive task we saw.
The knobs here are much less clear to me (we're already at opt-level = 1, and opt-level = 0 compeltely disables
optimizations). So, let's see what exactly is taking so long.
First, a brief look at the event format:
$ cat web_http_server.llvm_timings.jsonl | jq -c 'select(.name == "OptFunction")' | head
{"pid":25,"tid":30,"ts":7995006,"ph":"X","dur":32052,"name":"OptFunction","args":{"detail":"_RNvCscSpY9Juk0HT_7___rustc12___rust_alloc"}}
{"pid":25,"tid":30,"ts":8027059,"ph":"X","dur":242,"name":"OptFunction","args":{"detail":"_RNvCscSpY9Juk0HT_7___rustc14___rust_dealloc"}}
{"pid":25,"tid":30,"ts":8027302,"ph":"X","dur":158,"name":"OptFunction","args":{"detail":"_RNvCscSpY9Juk0HT_7___rustc14___rust_realloc"}}
{"pid":25,"tid":30,"ts":8027461,"ph":"X","dur":126,"name":"OptFunction","args":{"detail":"_RNvCscSpY9Juk0HT_7___rustc19___rust_alloc_zeroed"}}
{"pid":25,"tid":30,"ts":8027589,"ph":"X","dur":150,"name":"OptFunction","args":{"detail":"_RNvCscSpY9Juk0HT_7___rustc26___rust_alloc_error_handler"}}
{"pid":25,"tid":35,"ts":31457262,"ph":"X","dur":24576,"name":"OptFunction","args":{"detail":"_ZN10serde_json5value8to_value17h0315c73febebe85cE"}}
{"pid":25,"tid":35,"ts":31481850,"ph":"X","dur":11862,"name":"OptFunction","args":{"detail":"_ZN10serde_json5value8to_value17h0516143613516496E"}}
{"pid":25,"tid":35,"ts":31493764,"ph":"X","dur":15830,"name":"OptFunction","args":{"detail":"_ZN10serde_json5value8to_value17h0bdb4ac12d8ad59bE"}}
{"pid":25,"tid":35,"ts":31509615,"ph":"X","dur":8221,"name":"OptFunction","args":{"detail":"_ZN10serde_json5value8to_value17h0c630b789ee318c2E"}}
{"pid":25,"tid":35,"ts":31517858,"ph":"X","dur":8670,"name":"OptFunction","args":{"detail":"_ZN10serde_json5value8to_value17h12ba815471bb2bc8E"}}
In its raw form, each of the events' .args.detail field has the mangled symbol of the function being optimized. We can
"demangle" these back to the original Rust symbols with rustfilt — for example:
$ cargo install rustfilt $ rustfilt '_RNvCscSpY9Juk0HT_7___rustc12___rust_alloc'
__rustc::__rust_alloc
$ rustfilt '_ZN10serde_json5value8to_value17h0315c73febebe85cE'
serde_json::value::to_value
It's worth noting that in the list above, while there's several serde_json::value::to_value items, they actually have
distinct hashes:
$ rustfilt -h '_ZN10serde_json5value8to_value17h0315c73febebe85cE'
serde_json::value::to_value::h0315c73febebe85c
$ rustfilt -h '_ZN10serde_json5value8to_value17h0516143613516496E'
serde_json::value::to_value::h0516143613516496
$ rustfilt -h '_ZN10serde_json5value8to_value17h0bdb4ac12d8ad59bE'
serde_json::value::to_value::h0bdb4ac12d8ad59b
$ rustfilt -h '_ZN10serde_json5value8to_value17h0c630b789ee318c2E'
serde_json::value::to_value::h0c630b789ee318c2
$ rustfilt -h '_ZN10serde_json5value8to_value17h12ba815471bb2bc8E'
serde_json::value::to_value::h12ba815471bb2bc8
... which makes sense, given that serde_json::value::to_value is a generic function — it might be that it's being
optimized with different generic parameters ("monomorphizations").
The short answer is that optimization is done in the context of the crate where a function is monomorphized. So if we
define a type Foo and then call methods on Option<Foo>, those methods with those types will first exist in the
context of our crate — meaning it gets compiled and optimized with the same configuration as our crate.
With some knowledge about how the compiler works under the hood, this should hopefully make some sense — but from the outside, it's certainly a little odd!
Now that we know what we're looking at, we can start doing some analysis. For example, by finding the individual functions we spent the most time optimizing:
$ cat web_http_server.llvm_timings.jsonl \ | jq -c 'select(.name == "OptFunction")' \ | jq -sc 'sort_by(-.dur) | .[] | { dur: (.dur / 1e6), detail: .args.detail }' \ | head
{"dur":1.875744,"detail":"_ZN15web_http_server6photos11PhotosState3new28_$u7b$$u7b$closure$u7d$$u7d$17ha4de409b0951d78bE"}
{"dur":1.44252,"detail":"_ZN14tokio_postgres6client6Client5query28_$u7b$$u7b$closure$u7d$$u7d$17h18fb9179bb73bfa4E"}
{"dur":1.440186,"detail":"_ZN15web_http_server3run28_$u7b$$u7b$closure$u7d$$u7d$17h426fe76bd1b089abE"}
{"dur":1.397705,"detail":"_ZN15web_http_server6photos11PhotosState3new28_$u7b$$u7b$closure$u7d$$u7d$17ha4de409b0951d78bE"}
{"dur":1.170948,"detail":"_ZN14tokio_postgres11connect_raw11connect_raw28_$u7b$$u7b$closure$u7d$$u7d$17h0dfcfa0a648a93f8E"}
{"dur":1.158111,"detail":"_ZN14pulldown_cmark5parse15Parser$LT$F$GT$19handle_inline_pass117hc91a3dc90e0e9e0cE"}
{"dur":1.131707,"detail":"_ZN129_$LT$axum..boxed..MakeErasedHandler$LT$H$C$S$GT$$u20$as$u20$axum..boxed..ErasedIntoRoute$LT$S$C$core..convert..Infallible$GT$$GT$9clone_box17he7f38a2ccd053fbbE"}
{"dur":1.062162,"detail":"_ZN4core3ptr49drop_in_place$LT$http..extensions..Extensions$GT$17h89b138bb6c1aa101E"}
{"dur":1.026656,"detail":"_ZN15web_http_server3run28_$u7b$$u7b$closure$u7d$$u7d$17h426fe76bd1b089abE"}
{"dur":1.009844,"detail":"_ZN4core3ptr252drop_in_place$LT$$LT$alloc..vec..drain..Drain$LT$T$C$A$GT$$u20$as$u20$core..ops..drop..Drop$GT$..drop..DropGuard$LT$lol_html..selectors_vm..stack..StackItem$LT$lol_html..rewriter..rewrite_controller..ElementDescriptor$GT$$C$alloc..alloc..Global$GT$$GT$17h62ca0c07fce3ede0E"}
(Why two separate jq invocations? If we did just one, the -s/--slurp call would load the entire file
into a single array before any processing, which is one of the key operations we're trying to avoid)
This is a surprising amount of time on individual functions! Profiling roughly doubled the total time to compile, but even 1 second optimizing a single function is quite a long time!
But let's look into more detail here. We've got:
web_http_server::photos::PhotosState::new::{{closure}}— this is some closure inside a giant, 400-line async function that does the setup for https://sharnoff.io/photosweb_http_server::run::{{closure}}— this is inside the main entrypoint (also async), but all the closures are small error-handling, like.wrap_err_with(|| format!("failed to bind address {addr:?}"))- Maybe there's something weird going on here!
... and a handful of dependencies that also took a while:
Alternately, we could break it down by the outermost crate:
$ cat web_http_server.llvm_timings.jsonl \ | jq -r 'select(.name == "OptFunction") | "\(.dur) \(.args.detail)"' \ | xargs -l bash -c 'echo "{\"dur\":$0,\"root\":\"$(rustfilt "$1" | sed -E "s/^([a-z_-]+)::.*/\1/g")\"}"' \ | jq -s -r 'group_by(.root) | map({ root: .[0].root, dur: (map(.dur) | add) }) | sort_by(-.dur) | .[] | "\(.dur / 1e6) \(.root)"' \ | head
61.534452 core
13.750173 web_http_server
11.237289 tokio
7.890088 tokio_postgres
6.851621 lol_html
4.470053 alloc
4.177471 feed_rs
3.269217 std
3.067573 hashbrown
3.063146 eyre
This is, of course, a very imperfect measure — the outermost crate isn't necessarily the best one to attribute the
compilation time to, and there's a lot of items like <Foo as Bar>::baz that aren't captured by this simple filtering.
But all that aside, it's still surprising that there's so much from core!
Digging further, 84% of that time is just parameterizations of core::ptr::drop_in_place!
The long compile times for closures seems very suspicious — maybe it's worth digging further. There's just one
problem: the symbols all end with {{closure}} without saying which one is taking all the time.
As it turns out, there's an easy fix! As of June 2025, rustc currently uses the "legacy" symbol mangling format by
default, but there's a newer option with more information: the v0 format.
We can enable it by adding RUSTFLAGS="-C symbol-mangling-version=v0" to our existing flags, which now look something
like:
RUSTC_BOOTSTRAP=1 RUSTFLAGS="-Csymbol-mangling-version=v0 -Zllvm-time-trace" cargo build --timings ...
(aside: The issue for that feature's been open for 6 years, why hasn't it been merged yet? Turns out, there's a lot of
upstream work required to add support in common tools like gdb and perf. A lot of that has been done, but not yet
everything.)
The end result of this is that we get much better symbols coming out of the LLVM trace. As an example, here's what
those serde_json::value::to_value symbols look like now:
$ cat web_http_server.llvm_timings.jsonl | jq -c 'select(.name == "OptFunction")' | grep -E 'serde_json.+value.+to_value' | head
{"pid":25,"tid":35,"ts":34400185,"ph":"X","dur":7336,"name":"OptFunction","args":{"detail":"_RINvNtCs9KWWFfvvCPd_10serde_json5value8to_valueINtNCNvCs5etrU9lJXb7_15web_http_server5index012IndexContextNtNtNtNtBQ_4blog6handle7context9RootIndexNtNtNtNtBQ_6photos6handle7context9RootIndexEEBQ_"}}
{"pid":25,"tid":35,"ts":34407530,"ph":"X","dur":13226,"name":"OptFunction","args":{"detail":"_RINvNtCs9KWWFfvvCPd_10serde_json5value8to_valueNtNtNtNtCs5etrU9lJXb7_15web_http_server4blog6handle7context4PostEBR_"}}
{"pid":25,"tid":35,"ts":34420761,"ph":"X","dur":10344,"name":"OptFunction","args":{"detail":"_RINvNtCs9KWWFfvvCPd_10serde_json5value8to_valueNtNtNtNtCs5etrU9lJXb7_15web_http_server4blog6handle7context5IndexEBR_"}}
{"pid":25,"tid":35,"ts":34431114,"ph":"X","dur":11100,"name":"OptFunction","args":{"detail":"_RINvNtCs9KWWFfvvCPd_10serde_json5value8to_valueNtNtNtNtCs5etrU9lJXb7_15web_http_server6photos6handle7context11AlbumsIndexEBR_"}} $ rustfilt '_RINvNtCs9KWWFfvvCPd_10serde_json5value8to_valueINtNCNvCs5etrU9lJXb7_15web_http_server5index012IndexContextNtNtNtNtBQ_4blog6handle7context9RootIndexNtNtNtNtBQ_6photos6handle7context9RootIndexEEBQ_'
serde_json::value::to_value::<web_http_server::index::{closure#0}::IndexContext<web_http_server::blog::handle::context::RootIndex, web_http_server::photos::handle::context::RootIndex>>
$ rustfilt '_RINvNtCs9KWWFfvvCPd_10serde_json5value8to_valueNtNtNtNtCs5etrU9lJXb7_15web_http_server4blog6handle7context4PostEBR_'
serde_json::value::to_value::<web_http_server::blog::handle::context::Post>
$ rustfilt '_RINvNtCs9KWWFfvvCPd_10serde_json5value8to_valueNtNtNtNtCs5etrU9lJXb7_15web_http_server4blog6handle7context5IndexEBR_'
serde_json::value::to_value::<web_http_server::blog::handle::context::Index>
$ rustfilt '_RINvNtCs9KWWFfvvCPd_10serde_json5value8to_valueNtNtNtNtCs5etrU9lJXb7_15web_http_server6photos6handle7context11AlbumsIndexEBR_'
serde_json::value::to_value::<web_http_server::photos::handle::context::AlbumsIndex>
So not only do we get better closure labeling (see e.g. {closure#0}) but we also get full generics for everything!
Exactly what's taking so long should be much clearer now:
$ cat web_http_server.llvm_timings.jsonl \ | jq -r 'select(.name == "OptFunction") | "\(.dur) \(.args.detail)"' \ | xargs -l bash -c 'echo "{\"dur\":$0,\"fn\":\"$(rustfilt "$1")\"}"' \ | jq -sr 'sort_by(-.dur) | .[] | "\(.dur / 1e4 | round | . / 1e2)s \(.fn)"' \ | head -n5
1.99s <web_http_server::photos::PhotosState>::new::{closure#0}
1.56s web_http_server::run::{closure#0}
1.41s <web_http_server::photos::PhotosState>::new::{closure#0}
1.22s core::ptr::drop_in_place::<axum::routing::Endpoint<web_http_server::AppState>>
1.15s core::ptr::drop_in_place::<axum::routing::method_routing::MethodEndpoint<web_http_server::AppState, core::convert::Infallible>>
... but those first few closures are tiny:
let is_jpg = |path: &Path| path.extension().and_then(|s| s.to_str()) == Some("jpg");
and
let app = axum::Router::new() .route("/feed.xml", axum::routing::get(move || async move { feed }))
And if we remove these closures, replacing them with separately defined functions where possible, LLVM still reports
taking a long time to optimize {closure#0} in the outer function.
After dumping the LLVM IR with RUSTFLAGS="--emit=llvm-ir" (which places it into target/.../deps/*.ll) and searching
through the generated functions, I found a line like:
That process_photo function was a nested async function, defined directly inside PhotosState::new — so why did the
symbol say it was defined inside a closure?
It's because rustc internally represents async functions/blocks with a nested closure. So all of these places that
we had async functions where compiling closure#0 took a long time were actually just referring to the function itself!
With some quick github searching (is:issue state:open async fn closure mangle), it turned out there was already an
open issue about this!
Going back to our list from before – those async functions where LLVM takes a long time to optimize closure#0 are
really just spending a long time on the body of the function itself. It would make sense that big functions are hard to
optimize, and async functions doubly so.
It's fairly straightforward to identify all of the functions inside the main crate that are taking a long time:
$ cat web_http_server.llvm_timings.jsonl \ | jq -r 'select(.name == "OptFunction") | "\(.dur) \(.args.detail)"' \ | xargs -l bash -c 'echo "{\"dur\":$0,\"fn\":\"$(rustfilt "$1")\"}"' \ | jq -sc 'group_by(.fn) | map({ fn: .[0].fn, dur: (map(.dur) | add) }) | sort_by(-.dur) | .[]' \ | jq -r 'select(.fn | test("^(core::ptr::drop_in_place::<)?<*web_http_server")) | "\(.dur / 1e4 | round | . / 1e2)s \(.fn)"' \ | head -n10
4.11s <web_http_server::photos::PhotosState>::new::{closure#0}
3.05s web_http_server::run::{closure#0}
1.44s core::ptr::drop_in_place::<web_http_server::run::{closure#0}>
0.6s <web_http_server::reading_list::handle::post_login as axum::handler::Handler<(axum_core::extract::private::ViaRequest, axum::extract::state::State<&web_http_server::reading_list::ReadingListState>, axum::extract::state::State<&tera::tera::Tera>, axum_extra::extract::cookie::CookieJar, axum::form::Form<web_http_server::reading_list::handle::LoginForm>), web_http_server::AppState>>::call::{closure#0}
0.57s web_http_server::reading_list::fetch_posts_data::{closure#0}
0.51s <web_http_server::reading_list::ReadingListState>::make_pool::{closure#0}
0.44s <web_http_server::reading_list::ReadingListState>::refresh_single::{closure#0}
0.38s <web_http_server::photos::PhotosState>::process_photo::{closure#0}
0.38s <web_http_server::html::WriteState>::process_event
0.33s core::ptr::drop_in_place::<<web_http_server::reading_list::ReadingListState>::run_refresh::{closure#0}::{closure#0}>
Some of the most expensive functions here are around setup.
Let's try breaking up just one function, to see if it helps. We'll start with PhotosState::new.
before any changes: full timings for PhotosState::new
$ cat web_http_server.llvm_timings.jsonl \ | jq -r 'select(.name == "OptFunction") | "\(.dur) \(.args.detail)"' \ | xargs -l bash -c 'echo "{\"dur\":$0,\"fn\":\"$(rustfilt "$1")\"}"' \ | jq -sc 'group_by(.fn) | map({ fn: .[0].fn, dur: (map(.dur) | add) }) | sort_by(-.dur) | .[]' \ | jq 'select(.fn | test("^(core::ptr::drop_in_place::<)?<web_http_server::photos::PhotosState>::new")) | .dur' \ | jq -sr 'add | . / 1e4 | round | . / 1e2 | "\(.)s"'
5.3s $ cat web_http_server.llvm_timings.jsonl \ | jq -r 'select(.name == "OptFunction") | "\(.dur) \(.args.detail)"' \ | xargs -l bash -c 'echo "{\"dur\":$0,\"fn\":\"$(rustfilt "$1")\"}"' \ | jq -sc 'group_by(.fn) | map({ fn: .[0].fn, dur: (map(.dur) | add) }) | sort_by(-.dur) | .[]' \ | jq -r 'select(.fn | test("^(core::ptr::drop_in_place::<)?<web_http_server::photos::PhotosState>::new")) | "\(.dur / 1e4 | round | . / 1e2)s \(.fn)"'
4.11s <web_http_server::photos::PhotosState>::new::{closure#0}
0.27s core::ptr::drop_in_place::<<web_http_server::photos::PhotosState>::new::{closure#0}>
0.24s core::ptr::drop_in_place::<<web_http_server::photos::PhotosState>::new::{closure#0}::{closure#2}::{closure#0}>
0.23s core::ptr::drop_in_place::<<web_http_server::photos::PhotosState>::new::{closure#0}::{closure#2}>
0.19s core::ptr::drop_in_place::<<web_http_server::photos::PhotosState>::new::{closure#0}::{closure#6}::{closure#0}>
0.11s core::ptr::drop_in_place::<<web_http_server::photos::PhotosState>::new::{closure#0}::{closure#7}::{closure#0}>
0.03s <web_http_server::photos::PhotosState>::new::{closure#0}::{closure#6}::{closure#0}
0.02s <web_http_server::photos::PhotosState>::new::{closure#0}::{closure#3}
0.02s <web_http_server::photos::PhotosState>::new::{closure#0}::{closure#11}
0.02s <web_http_server::photos::PhotosState>::new::{closure#0}::{closure#4}
0.02s <web_http_server::photos::PhotosState>::new::{closure#0}::{closure#5}
0.01s <web_http_server::photos::PhotosState>::new::{closure#0}::{closure#2}
0.01s <web_http_server::photos::PhotosState>::new::{closure#0}::{closure#7}::{closure#0}
0.01s <web_http_server::photos::PhotosState>::new::{closure#0}::{closure#2}::{closure#0}
0.01s <web_http_server::photos::PhotosState>::new::{closure#0}::{closure#1}::{closure#1}
On the first attempt, I tried breaking it up while also preserving the number of .awaits – it's easy to do both
accidentally, and this would hopefully isolate which type of complexity is causing problems.
After naive splitting: full timings for photos::init
$ cat web_http_server.llvm_timings.jsonl \ | jq -r 'select(.name == "OptFunction") | "\(.dur) \(.args.detail)"'
 | xargs -l bash -c 'echo "{\"dur\":$0,\"fn\":\"$(rustfilt "$1")\"}"' \ | jq -sc 'group_by(.fn) | map({ fn: .[0].fn, dur: (map(.dur) | add) }) | sort_by(-.dur) | .[]' \ | jq 'select(.fn | test("^(core::ptr::drop_in_place::<)?<*web_http_server::photos::(init|PhotosState>::new)")) | .dur' \ | jq -sr 'add | . / 1e4 | round | . / 1e2 | "\(.)s"'
4.66s $ cat web_http_server.llvm_timings.jsonl \ | jq -r 'select(.name == "OptFunction") | "\(.dur) \(.args.detail)"' \ | xargs -l bash -c 'echo "{\"dur\":$0,\"fn\":\"$(rustfilt "$1")\"}"' \ | jq -sc 'group_by(.fn) | map({ fn: .[0].fn, dur: (map(.dur) | add) }) | sort_by(-.dur) | .[]' \ | jq -r 'select(.fn | test("^(core::ptr::drop_in_place::<)?<*web_http_server::photos::(init|PhotosState>::new)")) | "\(.dur / 1e4 | round | . / 1e2)s \(.fn)"'
3.37s web_http_server::photos::init::make_state::{closure#0}
0.24s core::ptr::drop_in_place::<web_http_server::photos::init::image_process_futs::{closure#0}::{closure#0}>
0.21s core::ptr::drop_in_place::<web_http_server::photos::init::album_process_futs::{closure#0}>
0.21s core::ptr::drop_in_place::<web_http_server::photos::init::make_state::{closure#0}>
0.16s core::ptr::drop_in_place::<web_http_server::photos::init::image_process_futs::{closure#0}>
0.12s core::ptr::drop_in_place::<web_http_server::photos::init::album_process_futs::{closure#1}>
0.06s web_http_server::photos::init::album_process_futs::{closure#0}
0.04s web_http_server::photos::init::image_process_futs::{closure#0}
0.03s web_http_server::photos::init::album_process_futs::{closure#1}
0.03s web_http_server::photos::init::album_process_futs
0.02s core::ptr::drop_in_place::<web_http_server::photos::init::get_img_candidates::{closure#0}>
0.02s web_http_server::photos::init::make_album_membership
0.02s web_http_server::photos::init::make_state::{closure#0}::{closure#1}
0.02s web_http_server::photos::init::make_albums_in_order
0.02s web_http_server::photos::init::image_process_futs
0.02s web_http_server::photos::init::make_state::{closure#0}::{closure#3}
0.02s web_http_server::photos::init::make_state::{closure#0}::{closure#2}
0.02s web_http_server::photos::init::image_process_futs::{closure#0}::{closure#0}
0.02s web_http_server::photos::init::make_state::{closure#0}::{closure#7}
0.01s web_http_server::photos::init::make_all_album
0.01s web_http_server::photos::init::make_recently_published_albums
0.01s web_http_server::photos::init::make_images_by_time
0s web_http_server::photos::init::get_img_candidates::{closure#0}::{closure#1}::{closure#1}
Interestingly, this didn't help all that much: only reducing the total time from 5.3s to 4.7s.
So to add to that, I tried merging a handful of neighboring .awaits into their own functions — reducing the total
number from 10 to 3.
After grouping .awaits
$ cat web_http_server.llvm_timings.jsonl \ | jq -r 'select(.name == "OptFunction") | "\(.dur) \(.args.detail)"'
 | xargs -l bash -c 'echo "{\"dur\":$0,\"fn\":\"$(rustfilt "$1")\"}"' \ | jq -sc 'group_by(.fn) | map({ fn: .[0].fn, dur: (map(.dur) | add) }) | sort_by(-.dur) | .[]' \ | jq 'select(.fn | test("^(core::ptr::drop_in_place::<)?<*web_http_server::photos::(init|PhotosState>::new)")) | .dur' \ | jq -sr 'add | . / 1e4 | round | . / 1e2 | "\(.)s"'
6.24s $ cat web_http_server.llvm_timings.jsonl \ | jq -r 'select(.name == "OptFunction") | "\(.dur) \(.args.detail)"' \ | xargs -l bash -c 'echo "{\"dur\":$0,\"fn\":\"$(rustfilt "$1")\"}"' \ | jq -sc 'group_by(.fn) | map({ fn: .[0].fn, dur: (map(.dur) | add) }) | sort_by(-.dur) | .[]' \ | jq -r 'select(.fn | test("^(core::ptr::drop_in_place::<)?<*web_http_server::photos::(init|PhotosState>::new)")) | "\(.dur / 1e4 | round | . / 1e2)s \(.fn)"'
2.7s web_http_server::photos::init::process_all_images::{closure#0}
1.93s web_http_server::photos::init::make_state::{closure#0}
0.25s core::ptr::drop_in_place::<web_http_server::photos::init::image_process_futs::{closure#0}::{closure#0}>
0.25s core::ptr::drop_in_place::<web_http_server::photos::init::album_process_futs::{closure#0}>
0.18s core::ptr::drop_in_place::<web_http_server::photos::init::image_process_futs::{closure#0}>
0.14s core::ptr::drop_in_place::<web_http_server::photos::init::album_process_futs::{closure#1}>
0.09s core::ptr::drop_in_place::<web_http_server::photos::init::process_all_images::{closure#0}>
0.08s core::ptr::drop_in_place::<web_http_server::photos::init::join_image_futs<web_http_server::photos::init::image_process_futs::{closure#0}>::{closure#0}>
0.07s core::ptr::drop_in_place::<web_http_server::photos::init::make_state::{closure#0}>
0.07s web_http_server::photos::init::album_process_futs::{closure#0}
0.06s core::ptr::drop_in_place::<web_http_server::photos::init::parse::{closure#0}>
0.04s core::ptr::drop_in_place::<web_http_server::photos::init::join_album_futs::{closure#0}>
0.04s web_http_server::photos::init::image_process_futs::{closure#0}
0.03s web_http_server::photos::init::album_process_futs
0.03s web_http_server::photos::init::make_album_membership
0.03s core::ptr::drop_in_place::<web_http_server::photos::init::get_img_candidates::{closure#0}>
0.03s web_http_server::photos::init::album_process_futs::{closure#1}
0.03s web_http_server::photos::init::make_albums_in_order
0.03s web_http_server::photos::init::image_process_futs
0.02s web_http_server::photos::init::process_all_images::{closure#0}::{closure#1}
0.02s web_http_server::photos::init::make_state::{closure#0}::{closure#0}
0.02s web_http_server::photos::init::make_state::{closure#0}::{closure#1}
0.02s web_http_server::photos::init::process_all_images::{closure#0}::{closure#2}
0.02s web_http_server::photos::init::image_process_futs::{closure#0}::{closure#0}
0.02s web_http_server::photos::init::make_all_album
0.01s web_http_server::photos::init::make_images_by_time
0.01s web_http_server::photos::init::make_recently_published_albums
0s web_http_server::photos::init::get_img_candidates::{closure#0}::{closure#1}::{closure#1}
But that took substantially longer! It increased from 4.66s to 6.24s!
At this point, it seemed like there was something strange happening with async functions. Otherwise, why would splitting into more functions make things worse?
Under the hood, async functions desugar to a complex state machine. There might be something odd happening there, so if
we want to make that simpler in the caller, we can turn the Future into a trait object to obscure the implementation
behind it (typically Pin<Box<dyn Future>>).
So this time, let's add a new function like:
fn erase<'a, T>( fut: impl 'a + Send + Future<Output = T>,
) -> Pin<Box<dyn 'a + Send + Future<Output = T>>> { Box::pin(fut)
}
and using it everywhere we .await. For example:
let candidates = get_img_candidates().await?; let candidates = erase(get_img_candidates()).await?;
Final change: Pin> the futures
$ cat web_http_server.llvm_timings.jsonl \ | jq -r 'select(.name == "OptFunction") | "\(.dur) \(.args.detail)"'
 | xargs -l bash -c 'echo "{\"dur\":$0,\"fn\":\"$(rustfilt "$1")\"}"' \ | jq -sc 'group_by(.fn) | map({ fn: .[0].fn, dur: (map(.dur) | add) }) | sort_by(-.dur) | .[]' \ | jq 'select(.fn | test("^(core::ptr::drop_in_place::<)?<*web_http_server::photos::(init|PhotosState>::new)")) | .dur' \ | jq -sr 'add | . / 1e4 | round | . / 1e2 | "\(.)s"'
2.14s $ cat web_http_server.llvm_timings.jsonl \ | jq -r 'select(.name == "OptFunction") | "\(.dur) \(.args.detail)"' \ | xargs -l bash -c 'echo "{\"dur\":$0,\"fn\":\"$(rustfilt "$1")\"}"' \ | jq -sc 'group_by(.fn) | map({ fn: .[0].fn, dur: (map(.dur) | add) }) | sort_by(-.dur) | .[]' \ | jq -r 'select(.fn | test("^(core::ptr::drop_in_place::<)?<*web_http_server::photos::(init|PhotosState>::new)")) | "\(.dur / 1e4 | round | . / 1e2)s \(.fn)"'
0.25s web_http_server::photos::init::process_all_images::{closure#0}
0.21s core::ptr::drop_in_place::<web_http_server::photos::init::image_process_futs::{closure#0}::{closure#0}>
0.2s core::ptr::drop_in_place::<web_http_server::photos::init::image_process_futs::{closure#0}>
0.2s web_http_server::photos::init::join_image_futs::<web_http_server::photos::init::image_process_futs::{closure#0}>::{closure#0}
0.19s core::ptr::drop_in_place::<web_http_server::photos::init::album_process_futs::{closure#0}>
0.13s web_http_server::photos::init::parse::{closure#0}
0.11s core::ptr::drop_in_place::<web_http_server::photos::init::album_process_futs::{closure#1}>
0.1s web_http_server::photos::init::get_img_candidates::{closure#0}
0.1s core::ptr::drop_in_place::<web_http_server::photos::init::make_state::{closure#0}>
0.06s core::ptr::drop_in_place::<web_http_server::photos::init::process_all_images::{closure#0}>
0.06s web_http_server::photos::init::album_process_futs::{closure#0}
0.06s web_http_server::photos::init::album_process_futs
0.05s web_http_server::photos::init::join_album_futs::{closure#0}
0.05s web_http_server::photos::init::make_albums_in_order
0.05s core::ptr::drop_in_place::<web_http_server::photos::init::join_image_futs<web_http_server::photos::init::image_process_futs::{closure#0}>::{closure#0}>
0.04s core::ptr::drop_in_place::<web_http_server::photos::init::parse::{closure#0}>
0.03s web_http_server::photos::init::image_process_futs::{closure#0}
0.03s web_http_server::photos::init::make_all_album
0.03s web_http_server::photos::init::album_process_futs::{closure#1}
0.02s core::ptr::drop_in_place::<web_http_server::photos::init::join_album_futs::{closure#0}>
0.02s core::ptr::drop_in_place::<web_http_server::photos::init::get_img_candidates::{closure#0}>
0.02s web_http_server::photos::init::make_state::{closure#0}::{closure#1}
0.02s web_http_server::photos::init::make_state::{closure#0}::{closure#0}
0.02s web_http_server::photos::init::make_recently_published_albums
0.02s web_http_server::photos::init::image_process_futs::{closure#0}::{closure#0}
0.01s web_http_server::photos::init::make_images_by_time
0.01s web_http_server::photos::init::erase::<core::result::Result<std::collections::hash::map::HashMap<alloc::string::String, &web_http_server::photos::Album>, eyre::Report>, web_http_server::photos::init::join_album_futs::{closure#0}>
0.01s web_http_server::photos::init::erase::<core::result::Result<web_http_server::photos::init::ProcessedImages, eyre::Report>, web_http_server::photos::init::process_all_images::{closure#0}>
0.01s web_http_server::photos::init::erase::<core::result::Result<(web_http_server::photos::MapSettings, web_http_server::photos::FlexGridSettings, web_http_server::photos::parsed::HiddenAlbumsAndPhotos, web_http_server::photos::parsed::Albums), eyre::Report>, web_http_server::photos::init::parse::{closure#0}>
0.01s web_http_server::photos::init::process_all_images::{closure#0}::{closure#1}
0.01s web_http_server::photos::init::process_all_images::{closure#0}::{closure#2}
0.01s web_http_server::photos::init::make_state
0.01s web_http_server::photos::init::get_img_candidates::{closure#0}::{closure#1}::{closure#1}
This one worked — down to 2.14s.
So, a reduction from 5.3s to 2.14s – a notable improvement, albeit with a lot of effort to get there. (and, for the
record, when I wrapped the futures with Box::pin instead of a fresh function, it didn't make a difference here).
Re-running the build without profiling, this gives a total reduction from 48.8s to 46.8s. It's pretty small, but that's from just a single function!
(Aside: What about #[inline(never)]? I tried it with and without – after boxing, compile times weren't any better
with inlining disabled for those functions, but it's still helpful for ensuring better attribution on the LLVM
timings.)
(Aside: What about disabling inlining on the poll functions? I also tried wrapping the async functions with a
Future implementation having #[inline(never)] on its poll function. That helped some, but wasn't as good as
boxing.)
There's a number of approaches available — let's try:
- Reducing inlining with LLVM args;
- Breaking up expensive functions in the main crate; and
- Removing generics from dependencies to prevent needing to compile it in the main crate
So, updating the final Dockerfile commands to read:
RUN RUSTFLAGS='-Cllvm-args=-inline-threshold=10 -Cllvm-args=-inlinedefault-threshold=10 -Cllvm-args=-inlinehint-threshold=10' \ cargo chef cook --release --target=x86_64-unknown-linux-musl --recipe-path=/workdir/recipe.json ... RUN RUSTFLAGS='-Cllvm-args=-inline-threshold=10 -Cllvm-args=-inlinedefault-threshold=10 -Cllvm-args=-inlinehint-threshold=10' \ cargo build --timings --release --target=x86_64-unknown-linux-musl --package web-http-server
... and many more small changes to the main crate:
$ git diff --stat base..HEAD -- web-http-server
... 10 files changed, 898 insertions(+), 657 deletions(-)
... alongside some changes to larger dependencies:
... gives us a final compile time of 32.3s.
The plot thickens!
After I shared this post, a couple folks on Bluesky gave some good tips!
- Enabling
-Zshare-generics; and - Switching away from Alpine
Piotr Osiewicz on Bluesky suggested enabling -Zshare-generics:
It'll reuse instantiations of generics from the dependencies of a crate. It is not enabled for release builds (by default), as it has a negative impact on codegen.
[ ... ]
The flag is available only on nightly, but it is enabled for dev builds even when using a stable tool chain.
Sounds neat! Let's try enabling it!
RUSTFLAGS="-Zshare-generics -Cllvm-args=-inline-threshold=10 -Cllvm-args=-inlinedefault-threshold=10 -Cllvm-args=-inlinehint-threshold=10" ...
The end result is interesting — a drop in total compile time from 32.3s to 29.1s, even though many of the
core::ptr::drop_in_places that we were compiling before are still present.
Looking at the biggest times, filtering just for drop_in_place for concrete types exposed by other crates:
$
$ cat ... | jq ... \ | grep -P 'core::ptr::drop_in_place::<(?!web_http_server)[a-zA-Z0-9_:]+>$' \ | head -n5
0.42s core::ptr::drop_in_place::<tracing_subscriber::filter::directive::ParseError>
0.13s core::ptr::drop_in_place::<http::uri::Uri>
0.12s core::ptr::drop_in_place::<toml_edit::item::Item>
0.11s core::ptr::drop_in_place::<std::io::error::Error>
0.1s core::ptr::drop_in_place::<hyper::body::incoming::Incoming> $
$ cat ... | jq ... \ | grep -P 'core::ptr::drop_in_place::<(?!web_http_server)[a-zA-Z0-9_:]+>$' \ | head -n5
0.59s core::ptr::drop_in_place::<hyper::ext::Protocol>
0.28s core::ptr::drop_in_place::<http::header::map::HeaderMap>
0.1s core::ptr::drop_in_place::<std::io::error::Error>
0.09s core::ptr::drop_in_place::<http::uri::Uri>
0.08s core::ptr::drop_in_place::<tokio::runtime::io::registration::Registration>
There's some change between them, but it's still compiling the same core::ptr::drop_in_place for a lot of
dependencies!
In spite of that though, the optimization time decreased substantially — from 21.7s to 17.4s if you look just at the
drop_in_place instantiations, and far more if you look at everything together (128s to 104s; across multiple threads,
with LLVM profiling's overhead).
Wesley Moore on Lobsters (via Bluesky) suggested switching away from Alpine, due to the impact that the default allocator can have on compile times:
In my experience the allocator can have a big impact on build times. For example when Chimera Linux switched from scudo (which was already better than the default musl allocator) to mimalloc a clean build of Gleam went from 67s to 46s.
Similar results can be observed by switching the base image of a build in docker [ ... ]
This made a huge difference.
After switching out alpine for debian and removing the --target=x86_64-unknown-linux-musl, the total compile time
dropped from 29.1s all the way down to 9.1s!
- We started at ~175s
- Disabling LTO (and debug symbols!) got us to 51s (-71%)
- Changing to
opt-level = 1on the final crate got us to 48.8s (-4%) - Reducing inlining with
-C llvm-argsgot us to 40.7s (-16%) - Local changes got us to 37.7s (-7%)
- Changes with dependencies got us to 32.3s (-14%)
Updated 2025-06-27:
- Enabling
-Zshare-genericsgot us to 29.1s (-10%) - And switching away from alpine got us to 9.1s (-69%)
While I did hit a lot of issues here, the tooling honestly worked really well – and the documentation was sufficient for someone with relatively little experience to make meaningful improvements to their codebase.
Some of the issues are straightforward: bugfixes to provide a nicer experience for the next person that finds themselves in a similar mess.
Others are more complicated:
-
The compile time of deep call graphs of async functions needs to be improved – perhaps LLVM has a degenerate edge case that's easy to trigger with what
rustcgenerates, or maybe it's as simple as a bad heuristic that's under-utilized in other languages. -
It might be worthwhile for
rustcto special-casecore::ptr::drop_in_place<T>so that it's compiled in the crate that definesT. That approach wouldn't work for everything – for example, generic types – but would prevent downstream crates from needing to re-compile the same destructor multiple times.- Update 2025-06-27:
-Zshare-genericsdoes help here, but it's not a complete fix. In the meantime, however, I found that this is actually something that's been previously discussed — unfortunately it seems like it causes severe increases in compile time due to compiling all the drop glue that would otherwise be unused. It's possible that there's some middle ground here (e.g., signaling that you want to prioritize compile times of the final binary to the detriment of the dependencies), but it's hard to say what the right approach is.
- Update 2025-06-27:
-
There might also be room for tooling to help with isolating which parts of a codebase are taking up the most time during compilation (and providing recommendations to mitigate) – although that's a longer project than just this post.
In the meantime, setting opt-level = 0 might be just fine :)
(questions? comments? Feel free to reach out below!)
Read the original article
Comments
One aspect that I find interesting is that Rust projects often seem deceivingly small.
First, dependencies don't translate easily to the perceived size. In C++ dependencies on large projects are often vendored (or even not used at all). And so it is easy to look at your ~400000 line codebase and go "it's slow, but there's a lot of code here after all".
Second (and a much worse problem) are macros. They actually hit the same issue. A macro that expands to 10s or 100s of lines can very quickly take your 10000 line project and turn it into a million line behemoth.
Third are generics. They also suffer the same problem. Every generic instantiation is eating your CPU.
But I do want to offer a bit of an excuse for rust. Because these are great features. They turn what would have taken 100000 lines of C or 25000 lines of C++ to a few 1000s lines of Rust.
However, there is definitely an overuse here making the ecosystem seem slow. For instance, at work we use async-graphql. The library itself is great, but it's an absolute proc-macro hog. There's issues in the repository open for years about the performance. You can literally feel the compiler getting slower for each type you add.
By jvanderbot 2025-06-2715:021 reply You can literally feel the compiler getting slower for each type you add.
YSK: The compiler performance is IIRC exponential in the "depth" of types. And oh boy does GraphQL love their nested types.
By taylorallred 2025-06-2620:2917 reply So there's this guy you may have heard of called Ryan Fleury who makes the RAD debugger for Epic. The whole thing is made with 278k lines of C and is built as a unity build (all the code is included into one file that is compiled as a single translation unit). On a decent windows machine it takes 1.5 seconds to do a clean compile. This seems like a clear case-study that compilation can be incredibly fast and makes me wonder why other languages like Rust and Swift can't just do something similar to achieve similar speeds.
By lordofgibbons 2025-06-2620:397 reply The more your compiler does for you at build time, the longer it will take to build, it's that simple.
Go has sub-second build times even on massive code-bases. Why? because it doesn't do a lot at build time. It has a simple module system, (relatively) simple type system, and leaves a whole bunch of stuff be handled by the GC at runtime. It's great for its intended use case.
When you have things like macros, advanced type systems, and want robustness guarantees at build time.. then you have to pay for that.
I think this is mostly a myth. If you look at Rust compiler benchmarks, while typechecking isn't _free_ it's also not the bottleneck.
A big reason that amalgamation builds of C and C++ can absolutely fly is because they aren't reparsing headers and generating exactly one object file so the linker has no work to do.
Once you add static linking to the toolchain (in all of its forms) things get really fucking slow.
Codegen is also a problem. Rust tends to generate a lot more code than C or C++, so while the compiler is done doing most of its typechecking work, the backend and assembler has a lot of things to chuck through.
By benreesman 2025-06-2712:423 reply The meme that static linking is slow or produces anything other than the best executables is demonstrably false and the result of surprisingly sinister agendas. Get out readelf and nm and PS sometime and do the arithematic: most programs don't link much of glibc (and its static link is broken by design, musl is better at just about everything). Matt Godbolt has a great talk about how dynamic linking actually works that should give anyone pause.
DLLs got their start when early windowing systems didn't quite fit on the workstations of the era in the late 80s / early 90s.
In about 4 minutes both Microsoft and GNU were like, "let me get this straight, it will never work on another system and I can silently change it whenever I want?" Debian went along because it gives distro maintainers degrees of freedom they like and don't bear the costs of.
Fast forward 30 years and Docker is too profitable a problem to fix by the simple expedient of calling a stable kernel ABI on anything, and don't even get me started on how penetrated everything but libressl and libsodium are. Protip: TLS is popular with the establishment because even Wireshark requires special settings and privileges for a user to see their own traffic, security patches my ass. eBPF is easier.
Dynamic linking moves control from users to vendors and governments at ruinous cost in performance, props up bloated industries like the cloud compute and Docker industrial complex, and should die in a fire.
Don't take my word for it, swing by cat-v.org sometimes and see what the authors of Unix have to say about it.
I'll save the rant about how rustc somehow manages to be slower than clang++ and clang-tidy combined for another day.
By jelder 2025-06-2713:43 CppCon 2018: Matt Godbolt “The Bits Between the Bits: How We Get to main()"
I think you're confused about my comment and this thread - I'm talking about build times.
By benreesman 2025-06-2716:31 You said something false and important and I took the opportunity to educate anyone reading about why this aspect of their computing experience is a mess. All of that is germane to how we ended up in a situation where someone is calling rustc with a Dockerfile and this is considered normal.
…surprisingly sinister agendas.
…
Dynamic linking moves control from users to vendors and governments at ruinous cost in performance, props up bloated industries...
This is ridiculous. Not everything is a conspiracy!
By benreesman 2025-06-2716:28 I didn't say anything was a conspiracy, let alone everything. I said inferior software is promoted by vendors on Linux as well as on MacOS and Windows with unpleasant consequences for users in a way that serves those vendors and the even more powerful institutions to which they are beholden. Sinister intentions are everywhere in this business (go read the opinions of the people who run YC), that's not even remotely controversial.
If fact, if there was anything remotely controversial about a bunch of extremely specific, extremely falsifiable claims I made, one imagines your rebuttal would have mentioned at least one.
I said inflmatory things (Docker is both arsonist and fireman at ruinous cost), but they're fucking true. That Alpine in the Docker jank? Links musl!
By k__ 2025-06-2714:11 That's an even more reasonable fear than trusting trust, and people seem to take that seriously.
Not only does it generate more code, the initially generated code before optimizations is also often worse. For example, heavy use of iterators means a ton of generics being instantiated and a ton of call code for setting up and tearing down call frames. This gets heavily inlined and flattened out, so in the end it's extremely well-optimized, but it's a lot of work for the compiler. Writing it all out classically with for loops and ifs is possible, but it's harder to read.
By estebank 2025-06-2714:29 For loops are sugar around an Iterator instantiation:
translates to roughlyfor i in 0..10 {}let mut iter = Range { start: 0, end: 10 }.into_iter(); while let Some(i) = iter.next() {}
By the-lazy-guy 2025-06-2712:07 > Once you add static linking to the toolchain (in all of its forms) things get really fucking slow.
Could you expand on that, please? Every time you run dynmically linked program, it is linked at runtime. (unless it explicitly avoids linking unneccessary stuff by dlopening things lazily; which pretty much never happens). If it is fine to link on every program launch, linking at build time should not be a problem at all.
If you want to have link time optimization, that's another story. But you absolutely don't have to do that if you care about build speed.
By fingerlocks 2025-06-270:353 reply The swift compiler is definitely bottle necked by type checking. For example, as a language requirement, generic types are left more or less in-tact after compilation. They are type checked independent of what is happening. This is unlike C++ templates which are effectively copy-pasting the resolved type with the generic for every occurrence of type resolution.
This has tradeoffs: increased ABI stability at the cost of longer compile times.
By slavapestov 2025-06-2715:18 > This has tradeoffs: increased ABI stability at the cost of longer compile times.
Nah. Slow type checking in Swift is primarily caused by the fact that functions and operators can be overloaded on type.
Separately-compiled generics don't introduce any algorithmic complexity and are actually good for compile time, because you don't have to re-type check every template expansion more than once.
By willtemperley 2025-06-274:162 reply A lot can be done by the programmer to mitigate slow builds in Swift. Breaking up long expressions into smaller ones and using explicit types where type inference is expensive for example.
I’d like to see tooling for this to pinpoint bottlenecks - it’s not always obvious what’s making builds slow.
>I’d like to see tooling for this to pinpoint bottlenecks - it’s not always obvious what’s making builds slow.
I second this enthusiastically.
By glhaynes 2025-06-2710:27 I'll third it. I've started to see more and more cargo culting of "fixes" that I'm extremely suspicious do nothing aside from making the code bulkier.
By never_inline 2025-06-2712:11 > Breaking up long expressions into smaller ones
If it improves compile time, that sounds like a bug in the compiler or the design of the language itself.
By windward 2025-06-278:26 >This is unlike C++ templates which are effectively copy-pasting the resolved type with the generic for every occurrence of type resolution.
Even this can lead to unworkable compile times, to the point that code is rewritten.
>Codegen is also a problem. Rust tends to generate a lot more code than C or C++
Wouldn't you say a lot of that comes from the macros and (by way of monomorphisation) the type system?
By jandrewrogers 2025-06-2715:48 Modern C++ in particular does a lot of similar, albeit not identical, codegen due to its extensive metaprogramming facilities. (C is, of course, dead simple.) I've never looked into it too much but anecdotally Rust does seem to generate significantly more code than C++ in cases where I would intuitively expect the codegen to be similar. For whatever reason, the "in theory" doesn't translate to "in practice" reliably.
I suspect this leaks into both compile-time and run-time costs.
By vintagedave 2025-06-2712:49 Delphi is static by default and incredibly fast too.
By ChadNauseam 2025-06-2621:213 reply That the type system is responsible for rust's slow builds is a common and enduring myth. `cargo check` (which just does typechecking) is actually usually pretty fast. Most of the build time is spent in the code generation phase. Some macros do cause problems as you mention, since the code that contains the macro must be compiled before the code that uses it, so they reduce parallelism.
By rstuart4133 2025-06-2621:361 reply > Most of the build time is spent in the code generation phase.
I can believe that, but even so it's caused by the type system monomorphising everything. When it use qsort from libc, you are using per-compiled code from a library. When you use slice::sort(), you get custom assembler compiled to suit your application. Thus, there is a lot more code generation going on, and that is caused by the tradeoffs they've made with the type system.
Rusts approach give you all sorts of advantages, like fast code and strong compile time type checking. But it comes with warts too, like fat binaries, and a bug in slice::sort() can't be fixed by just shipping of the std dynamic library, because there is no such library. It's been recompiled, just for you.
FWIW, modern C++ (like boost) that places everything in templates in .h files suffers from the same problem. If Swift suffers from it too, I'd wager it's the same cause.
By badmintonbaseba 2025-06-279:261 reply It's partly by the type system. You can implement a std::sort (or slice::sort()) that just delegates to qsort or a qsort-like implementation and have roughly the same compile time performance as just using qsort straight.
But not having to is a win, as the monomorphised sorts are just much faster at runtime than having to do an indirect call for each comparison.
By estebank 2025-06-2714:37 This is a pattern a crate author can rely on (write a function that uses genetics that immediately delegates to a function that uses trait objects or converts to the needed types eagerly so the common logic gets compiled only once), and there have been multiple efforts to have the compiler do that automatically. It has been called polymorphization and it comes up every now and then: https://internals.rust-lang.org/t/add-back-polymorphization/...
By tedunangst 2025-06-2622:322 reply I just ran cargo check on nushell, and it took a minute and a half. I didn't time how long it took to compile, maybe five minutes earlier today? So I would call it faster, but still not fast.
I was all excited to conduct the "cargo check; mrustc; cc" is 100x faster experiment, but I think at best, the multiple is going to be pretty small.
By ChadNauseam 2025-06-2623:491 reply Did you do it from a clean build? In that case, it's actually a slightly misleading metric, since rust needs to actually compile macros in order to typecheck code that uses them. (And therefore must also compile all the code that the macro depends on.) My bad for suggesting it, haha. Incremental cargo check is often a better way of seeing how long typechecking takes, since usually you haven't modified any macros that will need to be recompiled. On my project at work, incremental cargo check takes `1.71s`.
By estebank 2025-06-2714:48 Side note: There's an effort to cache proc macro invocations so that they get executed only once if the item they annotate hasn't changed: https://github.com/rust-lang/rust/pull/129102
There are multiple caveats on providing this to users (we can't assume that macro invocations are idempotent, so the new behavior would have to be opt in, and this only benefits incremental compilation), but it's in our radar.
By CryZe 2025-06-279:08 A ton of that is actually still doing codegen (for the proc macros for example).
Yes but I'd also add that Go specifically does not optimize well.
The compiler is optimized for compilation speed, not runtime performance. Generally speaking, it does well enough. Especially because it's usecase is often applications where "good enough" is good enough (IE, IO heavy applications).
You can see that with "gccgo". Slower to compile, faster to run.
By cherryteastain 2025-06-2622:191 reply Is gccgo really faster? Last time I looked it looked like it was abandoned (stuck at go 1.18, had no generics support) and was not really faster than the "actual" compiler.
By cogman10 2025-06-273:28 Digging around, looks like it's workload dependent.
For pure computational workloads, it'll be faster. However, anything with heavy allocation will suffer as apparently the gccgo GC and GC related optimizations aren't as good as cgo's.
By Mawr 2025-06-276:39 Not really. The root reason behind Go's fast compilation is that it was specifically designed to compile fast. The implementation details are just a natural consequence of that design decision.
Since fast compilation was a goal, every part of the design was looked at through a rough "can this be a horrible bottleneck?", and discarded if so. For example, the import (package) system was designed to avoid the horrible, inefficient mess of C++. It's obvious that you never want to compile the same package more than once and that you need to support parallel package compilation. These may be blindingly obvious, but if you don't think about compilation speed at design time, you'll get this wrong and will never be able to fix it.
As far as optimizations vs compile speed goes, it's just a simple case of diminishing returns. Since Rust has maximum possible perfomance as a goal, it's forced to go well into the diminishing returns territory, sacrificing a ton of compile speed for minor performance improvements. Go has far more modest performance goals, so it can get 80% of the possible performance for only 20% of the compile cost. Rust can't afford to relax its stance because it's competing with languages like C++, and to some extent C, that are willing to go to any length to squeeze out an extra 1% of perfomance.
By phplovesong 2025-06-2715:01 Thats not really true. As a counter example, Ocaml has a very advanced type system, full typeinference, generics and all that jazz. Still its on par, or even faster to compile than Go.
> Go has sub-second build times even on massive code-bases.
Unless you use sqlite, in which case your build takes a million years.
By Groxx 2025-06-2713:03 Yeah, I deal with multiple Go projects that take a couple minutes to link the final binary, much less build all the intermediates.
Compilation speed depends on what you do with a language. "Fast" is not an absolute, and for most people it depends heavily on community habits. Rust habits tend to favor extreme optimizability and/or extreme compile-time guarantees, and that's obviously going to be slower than simpler code.
By Zardoz84 2025-06-2622:00 Dlang compilers does more than any C++ compiler (metaprogramming, a better template system and compile time execution) and it's hugely faster. Language syntax design has a role here.
Because Russt and Swift are doing much more work than a C compiler would? The analysis necessary for the borrow checker is not free, likewise with a lot of other compile-time checks in both languages. C can be fast because it effectively does no compile-time checking of things beyond basic syntax so you can call foo(char) with foo(int) and other unholy things.
By steveklabnik 2025-06-2620:521 reply The borrow checker is usually a blip on the overall graph of compilation time.
The overall principle is sound though: it's true that doing some work is more than doing no work. But the borrow checker and other safety checks are not the root of compile time performance in Rust.
While the borrow checker is one big difference, it's certainly not the only thing the rust compiler offers on top of C that takes more work.
Stuff like inserting bounds checking puts more work on the optimization passes and codegen backend as it simply has to deal with more instructions. And that then puts more symbols and larger sections in the input to the linker, slowing that down. Even if the frontend "proves" it's unnecessary that calculation isn't free. Many of those features are related to "safety" due to the goals of the language. I doubt the syntax itself really makes much of a difference as the parser isn't normally high on the profiled times either.
Generally it provides stricter checks that are normally punted to a linter tool in the c/c++ world - and nobody has accused clang-tidy of being fast :P
By simonask 2025-06-279:49 It truly is not about bounds checks. Index lookups are rare in practical Rust code, and the amount of code generated from them is miniscule.
But it _is_ about the sheer volume of stuff passed to LLVM, as you say, which comes from a couple of places, mostly related to monomorphization (generics), but also many calls to tiny inlined functions. Incidentally, this is also what makes many "modern" C++ projects slow to compile.
In my experience, similarly sized Rust and C++ projects seem to see similar compilation times. Sometimes C++ wins due to better parallelization (translation units in Rust are crates, not source files).
By taylorallred 2025-06-2620:54 These languages do more at compile time, yes. However, I learned from Ryan's discord server that he did a unity build in a C++ codebase and got similar results (just a few seconds slower than the C code). Also, you could see in the article that most of the time was being spent in LLVM and linking. With a unity build, you nearly cut out link step entirely. Rust and Swift do some sophisticated things (hinley-milner, generics, etc.) but I have my doubts that those things cause the most slowdown.
By drivebyhooting 2025-06-2620:49 That’s not a good example. Foo(int) is analyzed by compiler and a type conversion is inserted. The language spec might be bad, but this isn’t letting the compiler cut corners.
By jvanderbot 2025-06-2621:111 reply If you'd like the rust compiler to operate quickly:
* Make no nested types - these slow compiler time a lot
* Include no crates, or ones that emphasize compiler speed
C is still v. fast though. That's why I love it (and Rust).
By windward 2025-06-278:31 >Make no nested types
I wouldn't like it that much
This explanation gets repeated over and over again in discussions about the speed of the Rust compiler, but apart from rare pathological cases, the majority of time in a release build is not spent doing compile-time checks, but in LLVM. Rust has zero-cost abstractions, but the zero-cost refers to runtime, sadly there's a lot of junk generated at compile-time that LLVM has to work to remove. Which is does, very well, but at cost of slower compilation.
Is it possible to generate less junk? Sounds like compiler developers took a shortcuts, which could be improved over time.
By LtdJorge 2025-06-278:16 Well, zero-cost abstractions are still abstractions. It’s not junk per-se, but things that will be optimized out if the IR has enough information to safely do so, so basically lots of extra metadata to actually prove to LLVM that these things are safe.
You can address the junk problem manually by having generic functions delegate as much of their work as possible to non-generic or "less" generic functions (Where a "less" generic function is one that depends only on a known subset of type traits, such as size or alignment. Then delegating can help the compiler generate fewer redundant copies of your code, even if it can't avoid code monomorphization altogether.)
I believe the specific advice they're referring to has been stable for a while. You take your generic function & split it into a thin generic wrapper, and a non-generic worker.
As an example, say your function takes anything that can be turned into a String. You'd write a generic wrapper that does the ToString step, then change the existing function to just take a String. That way when your function is called, only the thin outer function is monomorphised, and the bulk of the work is a single implementation.
It's not _that_ commonly known, as it only becomes a problem for a library that becomes popular.
By estebank 2025-06-2714:55 To illustrate:
  fn foo<S: Into<String>>(s: S) {
      fn inner(s: String) { ... }
      inner(s.into())
  }
By rcxdude 2025-06-2622:13 Probably, but it's the kind of thing that needs a lot of fairly significant overhauls in the compiler architecture to really move the needle on, as far as I understand.
I encountered one project in 2000-th with few dozens of KLoC in C++. It compiled in a fraction of a second on old computer. My hello world code with Boost took few seconds to compile. So it's not just about language, it's about structuring your code and using features with heavy compilation cost. I'm pretty sure that you can write Doom with C macros and it won't be fast. I'm also pretty sure, that you can write Rust code in a way to compile very fast.
By taylorallred 2025-06-2621:543 reply I'd be very interested to see a list of features/patterns and the cost that they incur on the compiler. Ideally, people should be able to use the whole language without having to wait so long for the result.
So there are few distinctive patterns I observed in that project. Please note that many of those patterns are considered anti-patterns by many people, so I don't necessarily suggest to use them.
1. Use pointers and do not include header file for class, if you need pointer to that class. I think that's a pretty established pattern in C++. So if you want to declare pointer to a class in your header, you just write `class SomeClass;` instead of `#include "SomeClass.hpp"`.
2. Do not use STL or IOstreams. That project used only libc and POSIX API. I know that author really hated STL and considered it a huge mistake to be included to the standard language.
3. Avoid generic templates unless absolutely necessary. Templates force you to write your code in header file, so it'll be parsed multiple times for every include, compiled to multiple copies, etc. And even when you use templates, try to split the class to generic and non-generic part, so some code could be moved from header to source. Generally prefer run-time polymorphism to generic compile-time polymorphism.
Why use C++ at that point? Also, pre declaring classes instead of including the corresponding headers has quite a few drawbacks.
By kccqzy 2025-06-2622:09 Templates as one single feature can be hugely variable. Its effect on compilation time can be unmeasurable. Or you can easily write a few dozen lines that will take hours to compile.
By LtdJorge 2025-06-278:19 There is an experimental Cranelift backend[0] for rustc to improve compilation performance in debug builds.
By herewulf 2025-06-278:12 My anecdata would be that the average C++ developer puts includes inside of every header file which includes more headers to the point where everything is including everything else and a single .cpp file draws huge swaths of unnecessary code in and the project takes eons to compile on a fast computer.
That's my 2000s development experience. Fortunately I've spent a good chunk of the 2010s and most of the 2020s using other languages.
The classic XKCD compilation comic exists for a reason.
By tptacek 2025-06-2620:36 I don't think it's interesting to observe that C code can be compiled quickly (so can Go, a language designed specifically for fast compilation). It's not a problem intrinsic to compilation; the interesting hard problem is to make Rust's semantics compile quickly. This is a FAQ on the Rust website.
By weinzierl 2025-06-279:04 This is sometimes called amalgamation and you can do it Rust as well. Either manually or with tools. The point is that apart from very specific niches it is just not a practical approach.
It's not that it can't be done but that it usually is not worth the hassle and our goal should be for compilation to be fast despite not everything being in one file.
Turbo Pascal is a prime example for a compiler that won the market not least because of its - for the time - outstanding compilation speed.
In the same vein, a language can be designed for fast compilation. Pascal in general was designed for single-pass compilation which made it naturally fast. All the necessary forward declarations were a pain though and the victory of languages that are not designed for single-pass compilation proofs that while doable it was not worth it in the end.
I bet that if you take those 278k lines of code and rewrite them in simple Rust, without using generics, or macros, and using a single crate, without dependencies, you could achieve very similar compile times. The Rust compiler can be very fast if the code is simple. It's when you have dependencies and heavy abstractions (macros, generics, traits, deep dependency trees) that things become slow.
By taylorallred 2025-06-2622:241 reply I'm curious about that point you made about dependencies. This Rust project (https://github.com/microsoft/edit) is made with essentially no dependencies, is 17,426 lines of code, and on an M4 Max it compiles in 1.83s debug and 5.40s release. The code seems pretty simple as well. Edit: Note also that this is 10k more lines than the OP's project. This certainly makes those deps suspicious.
The 'essentially no dependencies' isn't entirely true. It depends on the 'windows' crate, which is Microsoft's auto-generated Win32 bindings. The 'windows' crate is huge, and would be leading to hundreds of thousands of LoC being pulled in.
There's some other dependencies in there that are only used when building for test/benchmarking like serde, zstd, and criterion. You would need to be certain you're building only the library and not the test harness to be sure those aren't being built too.
I can't help but think the borrow checker alone would slow this down by at least 1 or 2 orders of magnitude.
By tomjakubowski 2025-06-2621:42 The borrow checker is really not that expensive. On a random example, a release build of the regex crate, I see <1% of time spent in borrowck. >80% is spent in codegen and LLVM.
By steveklabnik 2025-06-2621:15 Your intuition would be wrong: the borrow checker does not take much time at all.
By FridgeSeal 2025-06-2621:21 Again, as this been often repeated, and backed up with data, the borrow-checker is a tiny fraction of a Rust apps build time, the biggest chunk of time is spent in LLVM.
By john-h-k 2025-06-2710:07 My C compiler, which is pretty naive and around ~90,000 lines, can compile _itself_ in around 1 second. Clang can do it in like 0.4.
The simple truth is a C compiler doesn’t need to do very much!
> This seems like a clear case-study that compilation can be incredibly fast (...)
Have you tried troubleshooting a compiler error in a unity build?
Yeah.
By moffkalast 2025-06-2718:32 It compiles in 2 seconds! Does it run? No, but it was fast!
By ben-schaaf 2025-06-272:421 reply Every claim I've seen about unity builds being fast just never rings true to me. I just downloaded the rad debugger and ran the build script on a 7950x (about as fast as you can get). A debug build took 5s, a release build 34s with either gcc or clang.
Maybe it's a MSVC thing - it does seem to have some multi-threading stuff. In any case raddbg non-clean builds take longer than any of my rust projects.
I use unity builds day in day out. The speed up is an order of magnitude on a 2m+ LOC project.
If you want to see the difference download unreal engine and compile the editor with and without unity builds enabled.
My experience has been the polar opposite of yours - similar size rust projects are an order of magnitude slower than C++ ones. Could you share an example of a project to compare with?
By ben-schaaf 2025-06-2715:01 > If you want to see the difference download unreal engine and compile the editor with and without unity builds enabled.
UE doesn't use a full unity build, it groups some files together into small "modules". I can see how this approach may have some benefits; you're trading off a faster clean build for a slower incremental build.
I tested compiling UnrealFrontend, and a default setup with the hybrid unity build took 148s. I noticed it was only using half my cores due to memory constraints. I disabled unity and upped the parallelism and got 182s, so 22% slower while still using less memory. A similarly configured unity build was 108s, so best case is ~2x.
On the other hand only changing the file TraceTools/SFilterPreset.cpp resulted in 10s compilation time under a unity build, and only 2s without unit.
I can see how this approach has its benefits (and drawbacks). But to be clear this isn't what projects like raddbg and sqlite3 are doing. They're doing a single translation unit for the entire project. No parallelism, no incremental builds, just a single compiler invocation. This is usually what I've seen people mean by a unity build.
> My experience has been the polar opposite of yours - similar size rust projects are an order of magnitude slower than C++ ones. Could you share an example of a project to compare with?
I just did a release build of egui in 35s, about the same as raddbg's release build. This includes compiling dependencies like wgpu, serde and about 290 other dependencies which add up to well over a million lines of code.
Note I do have mold configured as my linker, which speeds things up significantly.
By almostgotcaught 2025-06-2714:471 reply How many LOC is unreal? I'm trying to estimate whether making LLVM compatible with UNITY_BUILD would be worth the effort.
EDIT: i signed up to get access to unreal so take a look at how they do unity builds and turns out they have their own build tool (not CMake) that orchestrates the build. so does anyone know (can someone comment) whether unity builds for them (unreal) means literally one file for literally all project sources files or if it's "higher-granularity" like UNITY_BUILD in CMake (i.e., single file per object).
By Culonavirus 2025-06-2715:37 At least 10M (from what I remember, maybe more now)
By glandium 2025-06-271:30 That is kind of surprising. The sqlite "unity" build, has about the same number of lines of C and takes a lot longer than that to compile.
By Aurornis 2025-06-2620:50 > makes me wonder why other languages like Rust and Swift can't just do something similar to achieve similar speeds.
One of the primary features of Rust is the extensive compile-time checking. Monomorphization is also a complex operation, which is not exclusive to Rust.
C compile times should be very fast because it's a relatively low-level language.
On the grand scale of programming languages and their compile-time complexity, C code is closer to assembly language than modern languages like Rust or Swift.
By 1vuio0pswjnm7 2025-06-274:08 Alpha. Windows-only.
https://codeload.github.com/EpicGamesExt/raddebugger/tar.gz/...
"Just". Probably because there's a lot of complexity you're waving away. Almost nothing is ever simple as "just".
At a previous company, we had a rule: whoever says "just" gets to implement it :)
By forrestthewoods 2025-06-2622:04 I wanted to ban “just” but your rule is better. Brilliant.
By taylorallred 2025-06-2620:511 reply That "just" was too flippant. My bad. What I meant to convey is "hey, there's some fast compiling going on here and it wasn't that hard to pull off. Can we at least take a look at why that is and maybe do the same thing?".
By steveklabnik 2025-06-2620:531 reply > "hey, there's some fast compiling going on here and it wasn't that hard to pull off. Can we at least take a look at why that is and maybe do the same thing?".
Do you really believe that nobody over the course of Rust's lifetime has ever taken a look at C compilers and thought about if techniques they use could apply to the Rust compiler?
By taylorallred 2025-06-2620:572 reply Of course not. But it wouldn't surprise me if nobody thought to use a unity build. (Maybe they did. Idk. I'm curious).
By steveklabnik 2025-06-2621:06 Rust and C have differences around compilation units: Rust's already tend to be much larger than C on average, because the entire crate (aka tree of modules) is the compilation unit in Rust, as opposed to the file-based (okay not if you're on some weird architecture) compilation unit of C.
Unity builds are useful for C programs because they tend to reduce header processing overhead, whereas Rust does not have the preprocessor or header files at all.
They also can help with reducing the number of object files (down to one from many), so that the linker has less work to do, this is already sort of done (though not to literally one) due to what I mentioned above.
In general, the conventional advice is to do the exact opposite: breaking large Rust projects into more, smaller compilation units can help do less "spurious" rebuilding, so smaller changes have less overall impact.
Basically, Rust's compile time issues lie elsewhere.
By ameliaquining 2025-06-2621:11 Can you explain why a unity build would help? Conventional wisdom is that Rust compilation is slow in part because it has too few translation units (one per crate, plus codegen units which only sometimes work), not too many.
By troupo 2025-06-277:55 There's also Jonathan Blow's jai where he routinely builds an entire game from scratch in a few seconds (hopefully public beta will be released by the end of this year).
By TZubiri 2025-06-279:21 I guess you can do that, but if for some reason you needed to compile separately, (suppose you sell the system to a third party to a client, and they need to modify module 1, module 2 and the main loop.) It would be pretty trivial to remove some #include "module3.c" lines and add some -o module3 options to the compiler. Right?
I'm not sure what Rust or docker have to do with this basic issue, it just feels like young blood attempting 2020 solutions before exploring 1970 solutions.
C hardly requires any high effort compile things. No templates, no generics, super simple types, no high level structures.
By dgb23 2025-06-2711:44 Are we seeing similar compilation speed when a Rust program doesn't use these types of features?
By maxk42 2025-06-2621:31 Rust is doing a lot more under the hood. C doesn't track variable lifetimes, ownership, types, generics, handle dependency management, or handle compile-time execution (beyond the limited language that is the pre-compiler). The rust compiler also makes intelligent (scary intelligent!) suggestions when you've made a mistake: it needs a lot of context to be able to do that.
The rust compiler is actually pretty fast for all the work it's doing. It's just an absolutely insane amount of additional work. You shouldn't expect it to compile as fast as C.
I’m glad that Go went the other way around: compilation speed over optimization.
For the kind of work I do — writing servers, networking, and glue code — fast compilation is absolutely paramount. At the same time, I want some type safety, but not the overly obnoxious kind that won’t let me sloppily prototype. Also, the GC helps. So I’ll gladly pay the price. Not having to deal with sigil soup is another plus point.
I guess Google’s years of experience led to the conclusion that, for software development to scale, a simple type system, GC, and wicked fast compilation speed are more important than raw runtime throughput and semantic correctness. Given the amount of networking and large - scale infrastructure software written in Go, I think they absolutely nailed it.
But of course there are places where GC can’t be tolerated or correctness matters more than development speed. But I don’t work in that arena and am quite happy with the tradeoffs that Go made.
By paldepind2 2025-06-2710:151 reply > I guess Google’s years of experience led to the conclusion that, for software development to scale, a simple type system, GC, and wicked fast compilation speed are more important than raw runtime throughput and semantic correctness.
I'm a fan of Go, but I don't think it's the product of some awesome collective Google wisdom and experience. Had it been, I think they'd have come to the conclusion that statically eliminating null pointer exceptions was a worthwhile endeavor, just to mention one thing. Instead, I think it's just the product of some people at Google making a language they way they wanted to.
By melodyogonna 2025-06-2714:111 reply But those people at Google were veteran researchers who wanted to make a language that could scale for Google's use cases; these things are well documented.
For example, Ken Thompson has said his job at Google was just to find things he could make better.
By nine_k 2025-06-2716:38 They also built a language that can be learned in a weekend (well, now two) and is small enough for a fresh grad hire to learn at the job.
Go has a very low barrier to entry, but also a relatively low ceiling. The proliferation of codegen tools for Go is a testament of its limited expressive power.
It doesn't mean that Go didn't hit a sweet spot. For certain tasks, it very much did.
By mike_hearn 2025-06-278:065 reply > fast compilation is absolutely paramount. At the same time, I want some type safety, but not the overly obnoxious kind that won’t let me sloppily prototype. Also, the GC helps
Well, that point in the design space was already occupied by Java which also has extremely fast builds. Go exists primarily because the designers wanted to make a new programming language, as far as I can tell. It has some nice implementation aspects but it picked up its users mostly from the Python/Ruby/JS world rather than C/C++/Java, which was the original target market they had in mind (i.e. Google servers). Scripting language users were in the market for a language that had a type system but not one that was too advanced, and which kept the scripting "feel" of very fast turnaround times. But not Java because that was old and unhip, and all the interesting intellectual space like writing libs/conf talks was camped on already.
By loudmax 2025-06-2713:10 As a system administrator, I vastly prefer to deploy Go programs over Java programs. Go programs are typically distributed as a single executable file with no reliance on external libraries. I can usually run `./program -h` and it tells me about all the flags.
Java programs rely on the JVM, of which there are many variants. Run time options are often split into multiple XML files -- one file for logging, another to control the number of threads and so on. Checking for the running process using `ps | grep` yields some long line that wraps the terminal window, or doesn't fit neatly into columns shown in `htop` or `btop`.
These complaints are mostly about conventions and idioms, not the languages themselves. I appreciate that the Java ecosystem is extremely powerful and flexible. It is possible to compile Java programs into standalone binaries, though I rarely see these in practice. Containers can mitigate the messiness, and that helps, up until the point when you need to debug some weird runtime issue.
I wouldn't argue that people should stop programming in Java, as there are places where it really is the best choice. For example deep legacy codebases, or where you need the power of the JVM for dynamic runtime performance optimizations.
There are a lot of places where Go is the best choice (eg. simple network services, CLI utilities), and in those cases, please, please deploy simple Go programs. Most of the time, developers will reach for whatever language they're most comfortable with.
What I like most about Go is how convenient it is, by default. This makes a big difference.
By rednafi 2025-06-2715:58 Java absolutely does not fill in the niche that Go targeted. Even without OO theology, JVM applications are heavy and memory intensive. Plus the startup time of the VM alone is a show stopper for the type of work I do. Also yes, Java isn’t hip and you couldn’t pay me to write it anymore.
Java still had slow startup and warmup time circa 2005-2007, on the order of 1-3 seconds for hello world and quite a bit more for real apps. That is horrendous for anything CLI based.
And you left out classloader/classpath/JAR dependency hell, which was horrid circa late 90s/early 2000s...and I'm guessing was still a struggle when Go really started development. Especially at Google's scale.
Don't get me wrong, Java has come a long way and is a fine language and the JVM is fantastic. But the java of 2025 is not the same as mid-to-late 2000s.
By mike_hearn 2025-06-2712:421 reply Maybe so, although I don't recall it being that bad.
But Go wasn't designed for CLI apps. It was designed for writing highly multi-threaded servers at Google, according to the designers, hence the focus on features like goroutines. And in that context startup time just doesn't matter. Startup time of servers at Google was (in that era) dominated by cluster scheduling, connecting to backends, loading reference data and so on. Nothing that a change in programming language would have fixed.
Google didn't use classloader based frameworks so that also wasn't relevant.
By frollogaston 2025-06-2716:56 Golang is frequently used for CLIs, even if it wasn't designed for that exactly
By frollogaston 2025-06-2716:371 reply Golang having solid n:m greenthreading day 1 was its big deal. Java has had no good way to do IO-heavy multitasking, leading to all those async/promise frameworks that jack up your code. I cannot even read the Java code we have at work. Java recently got virtual threads, but even if that fixes the problem, it'll be a while before things change to that. Python had the same problem before asyncio. This isn't even a niche thing, your typical web backend needs cooperative multitasking.
I'm also not fond of any of the Golang syntax, especially not having exceptions. Or if you want explicit errors, fine, at least provide nice unwrap syntax like Rust does.
By aaronblohowiak 2025-06-2718:20 by FAR my biggest complaint about Golang was null instead of Option. could have been special cased like their slice and map and would have been so so so much better than nil checks imho. really, a big miss.
"it picked up its users mostly from the Python/Ruby/JS world rather than C/C++/Java"
And with the increasing performance of Bun, it seems that Go is about to get a whooping by JS.
(Which isn't really true, as most of the Bun perf comes from Zig, but they are targeting JS Devs.)
Runtimes like Bun, Deno, or type systems like TypeScript don’t change the fact it’s still JS underneath — a crappily designed language that should’ve never left throwable frontend code.
None of these runtimes make JS anywhere even close to single-threaded Go perf, let alone multithreaded (goroutine) perf.
By frollogaston 2025-06-2716:451 reply JS is perfectly designed for what it does, frontend and non-CPU-intensive backend code. It's never going to reach singlethreaded Golang perf.
JavaScript was never designed for non-browser usage. It’s the community’s unquenchable thirst to use the same language everywhere that brought us here.
By frollogaston 2025-06-2718:29 NodeJS "about" page states its case pretty succinctly, JS was a good fit for IO-bound concurrent backends because of the event loop. This was at a time when no other major language had a good answer for this, unless you count Erlang. JS later got nicer syntax like async/await, and 0 = "" weirdness aside, it was otherwise ok. Plenty of people using it didn't even come from the web frontend side, myself included.
npm was also maybe the first default package manager that "just works," unlike Python or browser JS.
What are obnoxious types? Types either represent the data correctly or not. I think you can force types to shut up the compiler in any language including Haskell, Idris, PureScript...
I'd say you already get like 70% of the benefit of a type system with just the basic "you can't pass an int where string is expected". Being able to define your own types based on the basic ones, like "type Email string", so it's no longer possible to pass a "string" where "Email" is expected gets you to 80%. Add Result and Optional types (or arguably just sum types if you prefer) and you're at 95%. Anything more and you're pushing into diminishing returns.
By hgomersall 2025-06-278:431 reply Well it depends what you're doing. 95% is like, just your opinion man. The rust type system allows, in many cases, APIs that you cannot use wrongly, or are highly resistant to incorrect usage, but to do that requires careful thinking about. To be clear, such APIs are just as relevant internally to a project as externally if you want to design a system that is long term maintainable and robust and I would argue is the point when the type system starts to get really useful (rather than diminishing returns).
By rednafi 2025-06-2716:13 > The rust type system allows, in many cases, APIs that you cannot use wrongly, or are highly resistant to incorrect usage, but to do that requires careful thinking about
I need none of that guarantee and all of the compilation speed along with a language where juniors in my team can contribute quickly. Different problem space.
By ratorx 2025-06-279:06 This might work for the types you create, but what about all the code written in the language that expects the “proper” structure?
> Types either represent the data or not
This definitely required, but is only really the first step. Where types get really useful is when you need to change them later on. The key aspects here are how easily you can change them, and how much the language tooling can help.
By throwawaymaths 2025-06-2713:33 > Types either represent the data correctly or not.
No. two types can represent the same payload, but one might be a simple structure, the other one could be three or twenty nested type template abstractions deep, and created by a proc macro so you can't chase down how it was made so easily.
By liampulles 2025-06-2717:05 As the story goes, a couple of Google developers designed Go while waiting for one of their C++ projects to compile.
By frollogaston 2025-06-2716:311 reply Same but with Python and NodeJS cause I'm doing less performance-critical stuff. Dealing with type safety and slow builds would cost way more than it's worth.
Python and NodeJS bring a whole lot of other problems. But yeah at a smaller scale these languages are faster to work with.
At the same time, I have worked at places where people had to rewrite major parts of their backend in other languages because Python/Node was no longer sufficient.
By frollogaston 2025-06-2718:34 I'd have to see it, cause rewrites happen all the time. We had a system written in C++, then rewritten in Golang because C++ was supposedly not good enough, then rewritten back into C++.
By galangalalgol 2025-06-2623:301 reply That is exactly what go was meant for and there is nothing better than picking the right tool for the job. The only foot gun I have seen people run into is parallelism with mutable shared state through channels can be subtly and exploitably wrong. I don't feel like most people use channels like that though? I use rust because that isn't the job I have. I usually have to cramb slow algorithms into slower hardware, and the problems are usually almost but not quite embarrassingly parallel.
I think a lot of the materials that the Go folks put out in the early days encourage a very channel-heavy style of programming that leads to extremely bad places.
Nowadays the culture seems to have evolved a bit. I now go into high alert mode if I see a channel cross a function boundary or a goroutine that wasn't created via errgroup or similar.
People also seem to have chilled out about the "share by communicating" thing. It's usually better to just use a mutex and I think people recognise that now.
By rednafi 2025-06-2716:05 This is true. I have been writing Go for years and still think channel is a bit too low level. It probably would've benefited from a different layer of abstraction.
By silverwind 2025-06-279:37 You can have the best of both worlds: A fast, but sloppy compiler and slow, but thorough checkers/linters. I think it's ideal that way, but rust seems to have chosen to needlessly combine both actions into one.
By danielscrubs 2025-06-2710:362 reply One day I would like to just change pascals syntax a bit to be Pythonic and just blow the socks of junior and Go developers.
By the_sleaze_ 2025-06-2715:09 That's what they did to Erlang with Elixir and now there are a lot of people saying it's the Greatest Of All Time.
I'd be interested in this project if you do decide to pursue it.
By rednafi 2025-06-2716:08 Sounds like the guy who wanted to write curl in a weekend. /s
By melodyogonna 2025-06-2714:17 Isn't it heavily used in Google Cloud?
By homebrewer 2025-06-2711:241 reply Last time I paid any attention to Google's high level conference presenters (like Titus Winters), they almost didn't use Go at all. Judging by the sibling comment, this hasn't changed much. For some reason people are thinking that half of Google is written in Go at this point, when in reality if you listen to what they themselves are saying, it's 99% C++ and Java, with a tiny bit of Python and other languages where it makes sense.
It's just a project from a few very talented people who happen to draw their salary from Google's coffers.
By fireflash38 2025-06-2717:051 reply K8s isn't entirely in go?
By frollogaston 2025-06-2718:41 They don't really use K8S internally
C++ and Java. Go is still used, but it's never caught up to the big two.
By frollogaston 2025-06-2717:02 And probably more Java than C++
