If you have worked with observability tools in the last decade, you have likely managed, and been burnt by, a fragmented collection of tools and libraries. Each observability signal required its own tool, data formats were incompatible and had little or no correlation. For example, log records would not link to traces, meaning you had to guess which traces led to which events.
The OpenTelemetry Protocol (OTLP) solves this by decoupling how telemetry is generated from where it is analyzed. It is a general-purpose, vendor-neutral protocol designed to transfer telemetry (logs, metrics, and traces) data between any compatible source and destination.
What is OTLP?
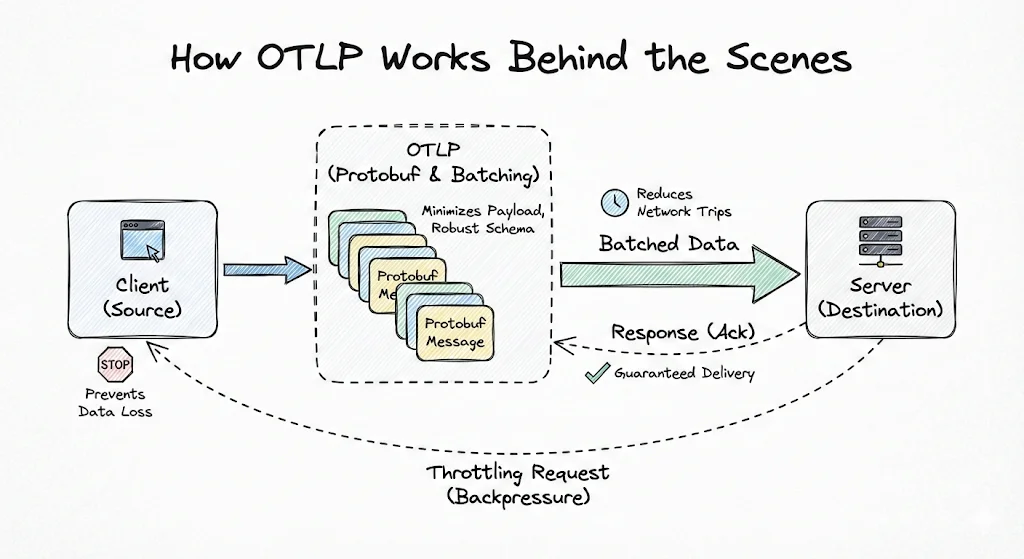
OTLP is the data-delivery protocol defined by the OpenTelemetry (OTel) project. While OpenTelemetry aims to standardize how telemetry data is generated, OTLP, as part of this mission, defines precisely how telemetry data is serialized and transmitted.
It acts as the universal language between clients (applications) and servers (OTel collectors or OpenTelemetry-native observability backends like SigNoz). When configured with exporters, your applications emit a clean, unified stream of data that any compatible backend can ingest without additional processing.
Why was OTLP Needed?
Before OTLP arrived, the observability landscape was fragmented because different signals required entirely different tools. This lack of a common standard meant vital context was lost as data formats were incompatible across the stack.
Further, engineers also found themselves vendor-locked. Because the application code used vendor-specific instrumentation agents, switching providers required weeks of effort. The prevailing mindset was just to make it work with the current toolset, rather than trying to improve it.
The daily routine of using these tools was equally frustrating. Since telemetry data was sent to isolated platforms, like Jaeger for tracing and Filebeat for logs, debugging a single incident led to frequent context switching. Anyone who has debugged a high-pressure production issue knows how difficult tracking moving parts is. Imagine doing that with minimal context on cause-and-effect!
OTLP’s unified standard gives teams the flexibility to use a single backend for all their observability needs. With the vendor lock-in barrier removed, observability tools must deliver better features. Consider SigNoz, which leverages OTLP to provide out-of-the-box APM dashboards for each service. Using the standardized data formats, SigNoz easily correlates traces, metrics, and logs across the entire platform, giving users a holistic view that wasn’t possible earlier.
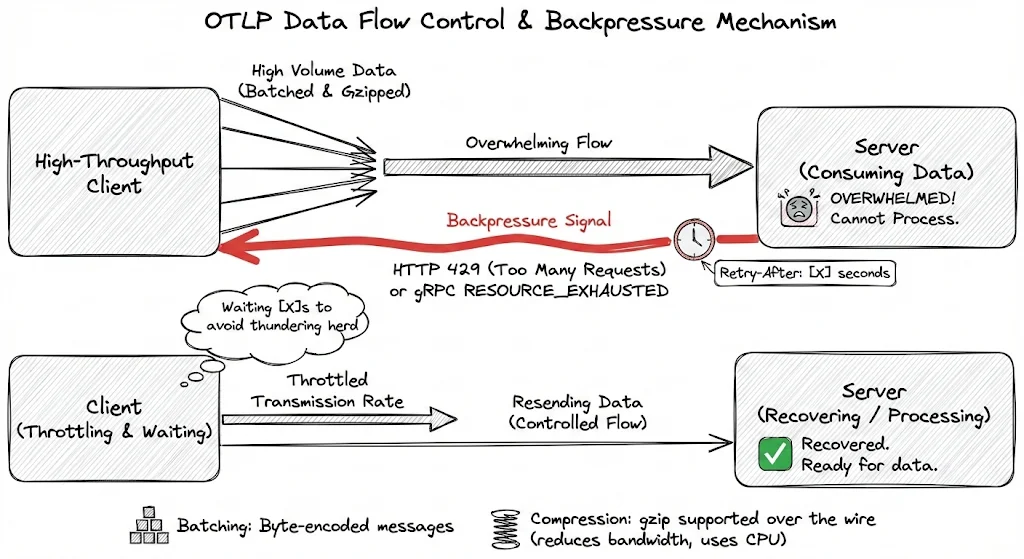
Finally, OTLP supports gzip compression to support high-demand scenarios. This enables clients to significantly reduce network bandwidth by minimizing payload size, in exchange for some CPU cost (for compressing-decompressing the messages).
Transport Protocols: gRPC and HTTP
OTLP supports data transmission over two protocols: gRPC and HTTP. Both transports utilize the same underlying Protobuf schema, ensuring that your data remains consistent and corruption-free regardless of the protocol choice.
OTLP/gRPC: The Performant Default
By default, OTLP transmits data over gRPC on port 4317. It is the preferred medium for data transfer because of its efficiency.
gRPC, running on top of HTTP/2, leverages multiplexing- instead of opening a new TCP connection for each request, it allows multiple data streams (traces, logs, and metrics) to share the same TCP connection. This significantly reduces network overhead and CPU cost associated with managing connection handshakes, making it ideal for high-throughput environments.
OTLP/HTTP: Universal Fallback
While gRPC is performant, it may not be accepted in strict network environments. Certain firewalls, proxies or old web environments may not accept gRPC or the underlying HTTP/2 traffic. HTTP is also the standard for browser-based environments (such as SPAs), which cannot easily use gRPC.
In this mode, clients send data to signal-specific endpoints like /v1/traces via standard POST requests. OTLP over HTTP is flexible regarding payload formats: clients use Protobuf for data encoding by setting the Content-Type: application/x-protobuf header. Alternatively, for easier debugging or tools that lack Protobuf support, you can send standard JSON.
Using JSON in pre-production or test environments might be ideal, as engineers can easily read the payload without any decoding.
Implementing OTLP in Your Tech Stack
You have now gained a deep understanding of what OTLP is, why it’s important, and how its internals work. The next logical step is to integrate OpenTelemetry into your tech stack. You can get started by following our documentation for Java instrumentation or Python instrumentation.
You will also require an observability platform to ingest and visualize your telemetry data when instrumenting your applications. SigNoz is built natively on OpenTelemetry and OTLP.
You can choose between various deployment options in SigNoz. The easiest way to get started with SigNoz is SigNoz cloud. We offer a 30-day free trial account with access to all features.
Those who have data privacy concerns and can't send their data outside their infrastructure can sign up for either enterprise self-hosted or BYOC offering.
Those who have the expertise to manage SigNoz themselves or just want to start with a free self-hosted option can use our community edition.
