We gave our AI agent a SQL interface to billions of CI log lines in ClickHouse. How we ingest, store, and query 1.5 billion log lines a week.
Last week, our agent traced a flaky test to a dependency bump three weeks prior. It did this by writing its own SQL queries, scanning hundreds of millions of log lines across a dozen queries, and following a trail from job metadata to raw log output. The whole investigation took seconds.
To do this, the agent needs context: not one log file, but every build, every test, every log line, across months of history. Every week, about 1.5 billion CI log lines and 700K jobs flow through our system. All of it lands in ClickHouse, compressed at 35:1. All of it is queryable in milliseconds.
A SQL interface for the agent
We expose a SQL interface to the agent, scoped to the organization it's investigating. The agent constructs its own queries based on the question. No predefined query library, no rigid tool API.
LLMs are good at SQL. There's an enormous amount of SQL in training data, and the syntax maps well to natural-language questions about data. A constrained tool API like get_failure_rate(workflow, days) would limit the agent to the questions we anticipated. A SQL interface lets it ask questions we never thought of, which matters when you're debugging novel failures.
The agent queries two main targets:
Job metadata: a materialized view with one row per CI job execution. The agent uses this 63% of the time for questions like "how often does this fail?", "what's the success rate?", "which jobs are slowest?", "when did this start failing?"
Raw log lines: one row per log line. The agent uses this 37% of the time for questions like "show me the error output for this job", "when did this log pattern first appear?", "how often does this error message occur across runs?"
52,000 queries across 8,500 investigations
We analyzed 8,534 agent sessions and 52,312 queries from our observability pipeline.
The agent doesn't stop at one query. It investigates. Starts broad, then drills in. Total rows scanned across all queries to answer one question:
| Target | Sessions | Avg queries | Median rows | P75 | P95 |
|---|---|---|---|---|---|
| Job metadata | 8,210 | 4.0 | 164K | 563K | 4.4M |
| Raw log lines | 5,413 | 3.5 | 4.4M | 69M | 4.3B |
| Combined | 8,534 | 4.4 | 335K | 5.2M | 940M |
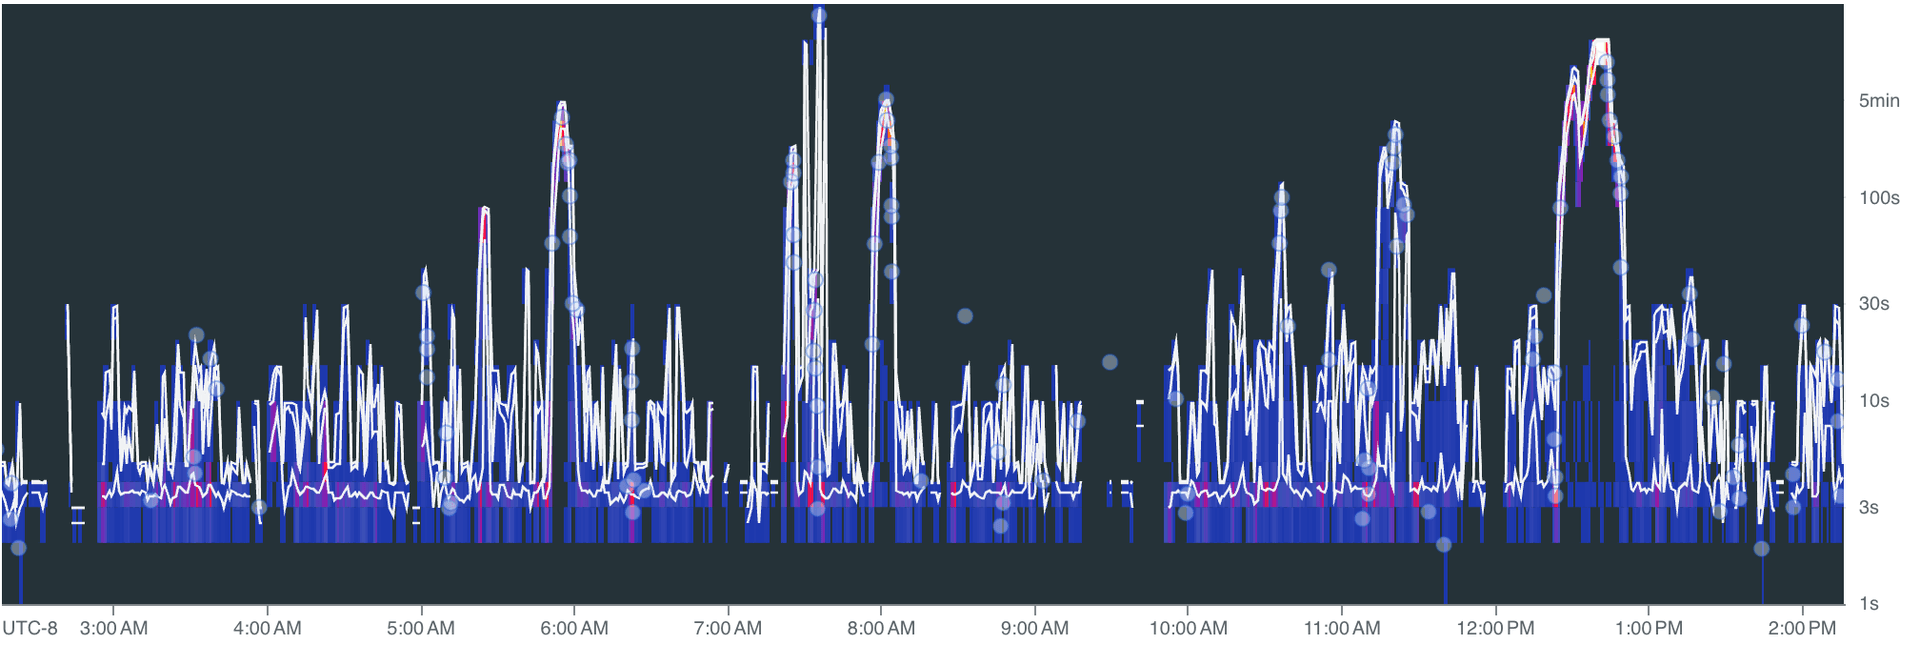
The typical question scans 335K rows across about 3 queries. At P75 it's 5.2 million rows. At P95 it's 940 million rows. The heaviest raw-log sessions, deep investigations tracing error patterns across months of history, scan 4.3 billion rows.
The search pattern
The agent starts broad and narrows. A typical investigation begins with job metadata: "what's the failure rate for this workflow?", "which jobs failed on this commit?" These are cheap queries (median 47K rows) against a compact, pre-aggregated materialized view.
When it finds something interesting, it drills into raw logs: "show me the stack trace for this specific failure", "has this error message appeared before?" These are the expensive queries (median 1.1M rows), full-text scans across log output. But this is exactly the kind of search that would take a human minutes of scrolling through GitHub Actions log viewers.
The agent averages 4.4 queries per session, but heavy investigations issue many more. A P95 session isn't one big query. It's the agent following a trail, query after query, as it narrows in on a root cause.
5 TiB uncompressed, 154 GiB on disk
For the agent to query this fast, the data needs to be structured for it. Up to 300 million log lines flow through on a busy day. We use ClickHouse.
The denormalization bet
Every log line in our system carries 48 columns of metadata: the full context of the CI run it belongs to. Commit SHA, author, branch, PR title, workflow name, job name, step name, runner info, timestamps, and more.
In a traditional row-store, this would be insane. You'd normalize. Run-level metadata in one table, job metadata in another, join at query time. Denormalizing 48 columns onto every single log line sounds like a storage disaster.
In ClickHouse's columnar format, it's essentially free.
A column like commit_message has the same value for every log line in a CI run, and a single run can produce thousands of log lines. ClickHouse stores those thousands of identical values in sequence. The compression algorithm sees the repetition and compresses it to almost nothing.
| Column | Compression ratio | Why |
|---|---|---|
commit_message | 301:1 | Same message for every line in a run (thousands of lines) |
display_title | 160:1 | Same PR/commit title across all lines |
workflow_path | 79:1 | Same .github/workflows/foo.yml path |
step_name | 52:1 | Same step name across hundreds of lines |
job_name | 48:1 | Same job name across hundreds/thousands of lines |
The agent asks arbitrary questions. One might filter by commit author, the next by runner label, the next by step name. Without denormalization, every one of those requires a join. With it, they're all column predicates.
The numbers
| Layer | Size |
|---|---|
Raw log text (line_content uncompressed) | 664 GiB |
| All 48 columns uncompressed | 5.31 TiB |
| On disk (compressed) | 154 GiB |
| Compression ratio | 35:1 |
The raw log text alone is 664 GiB. Adding all 48 columns of metadata inflates it to 5.31 TiB uncompressed, 8x the raw text. On disk, the whole thing compresses to 154 GiB. ClickHouse stores 8x more data (all the enriched metadata) in a quarter of the size of the raw text alone.
That's about 21 bytes per log line on disk, including all 48 columns. Yes, really. 21 bytes for a log line plus its commit SHA, author, branch, job name, step name, runner info, and 41 other fields.
Where the storage actually goes
Not all columns compress equally. The unique-per-row columns (log text, timestamp, line number) compress modestly and dominate storage. The metadata columns, which repeat across thousands of lines, are nearly free.
| Column | On disk | % of total | Compression ratio |
|---|---|---|---|
line_content (log text) | 53.2 GiB | 34.7% | 12.5:1 |
ts (nanosecond timestamp) | 15.7 GiB | 10.2% | 3.7:1 |
line_number | 12.4 GiB | 8.1% | 2.3:1 |
job_name | 8.2 GiB | 5.4% | 48:1 |
runner_name | 4.5 GiB | 2.9% | 31:1 |
job_id | 3.9 GiB | 2.5% | 15:1 |
runner_labels | 3.8 GiB | 2.5% | 52:1 |
| Everything else (41 columns) | ~51 GiB | ~33% | varies |
The top three (line_content, ts, line_number) account for 53% of all storage. Everything else is repeated metadata that compresses to almost nothing.
Query performance
We use a few ClickHouse patterns that keep things fast:
Primary key design means the data is physically sorted for our access pattern. The sort order is (org, ts, repository, run_id, ...), so every query is scoped to one organization and a time range, and ClickHouse skips everything else without reading it.
Skip indexes let ClickHouse avoid scanning data it doesn't need. We use bloom filters on 14 columns (org, repository, job name, branch, commit SHA, etc.) and an ngram bloom filter on line_content for full-text search. When the agent searches for an error message across billions of log lines, ClickHouse checks the ngram index to skip granules that can't contain the search term, turning a full table scan into a targeted read.
Materialized views pre-compute aggregations on insert. When the agent asks "what's the failure rate for this workflow over the last 30 days?", the answer is already computed. The aggregation happened when the data was written.
Async inserts give us high write throughput without building our own batching layer. We fire-and-forget individual inserts, and ClickHouse batches them internally.
Query latency across 52K queries:
| Target | Queries | Median | P75 | P95 |
|---|---|---|---|---|
| Job metadata | 33K | 20ms | 30ms | 80ms |
| Raw log lines | 19K | 110ms | 780ms | 18.1s |
Job metadata queries return in 20ms at the median. Raw log queries, scanning a million rows at the median, come back in 110ms.
Latency scales roughly linearly with rows scanned:
| Rows scanned | Queries | Median latency | P95 latency |
|---|---|---|---|
| < 1K | 1,621 | 10ms | 50ms |
| 1K-10K | 2,608 | 20ms | 50ms |
| 10K-100K | 27,044 | 20ms | 50ms |
| 100K-1M | 8,515 | 40ms | 390ms |
| 1M-10M | 7,199 | 90ms | 1.2s |
| 10M-100M | 2,630 | 690ms | 6.8s |
| 100M-1B | 1,814 | 6.8s | 30.6s |
| 1B+ | 1,029 | 31s | 82s |
10x more rows ≈ 10x more latency. 60% of all queries scan under 100K rows and return in under 50ms, fast enough that the agent can fire off several per second without breaking stride. At the extreme end, the agent occasionally scans over a billion rows in a single query; even those complete in about 30 seconds at the median.
Ingesting through GitHub's rate limit
None of the above works without fresh data. The agent needs to reason about the build that just failed, not one from an hour ago.
The rate limit constraint
GitHub's API gives you 15,000 requests per hour per App installation (5,000 on non-Enterprise plans). That sounds generous until you're continuously polling workflow runs, jobs, steps, and log output across dozens of active repositories. A single commit can spawn hundreds of parallel jobs, each producing logs you need to fetch.
And ingestion isn't the only thing hitting the API. When the agent investigates a failure, it pulls PR metadata, reads file diffs, posts comments, and opens pull requests. All of that counts against the same 15,000-request budget. Throttle ingestion too aggressively and your data goes stale. Throttle too little and you starve the agent of the API access it needs to do its job.
Early on, we hit this. Our ingestion would slam into the rate limit, get blocked for the remainder of the hour, and fall behind. By the time it caught up, we were ingesting logs from 30+ minutes ago. For an agent that needs to reason about the build that just failed, that's useless. If an engineer has to wait for the agent to catch up, they've already context-switched to investigating manually.
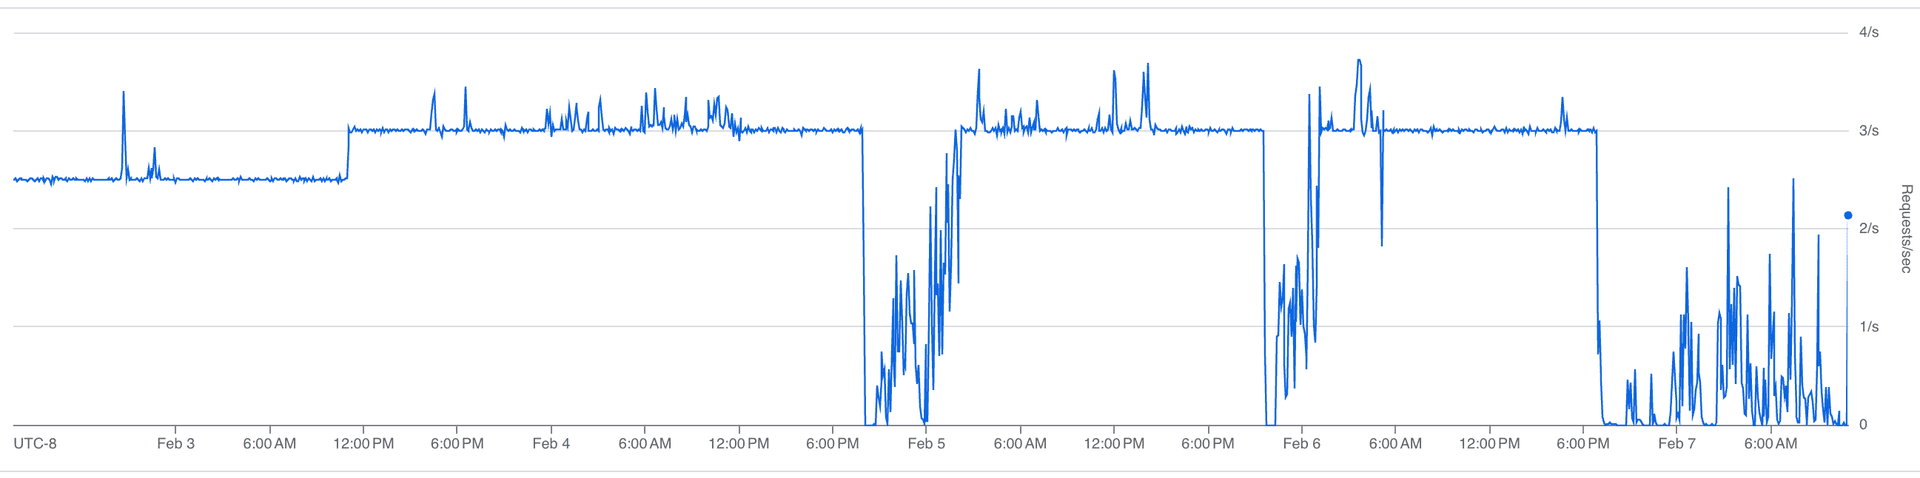
The fix was throttling: spreading requests evenly across the rate limit window instead of bursting. We cap ingestion at roughly 3 requests per second, keeping about 4,000 requests per hour free for the agent.
Our sustained request rate:
Our rate limit budget over time:
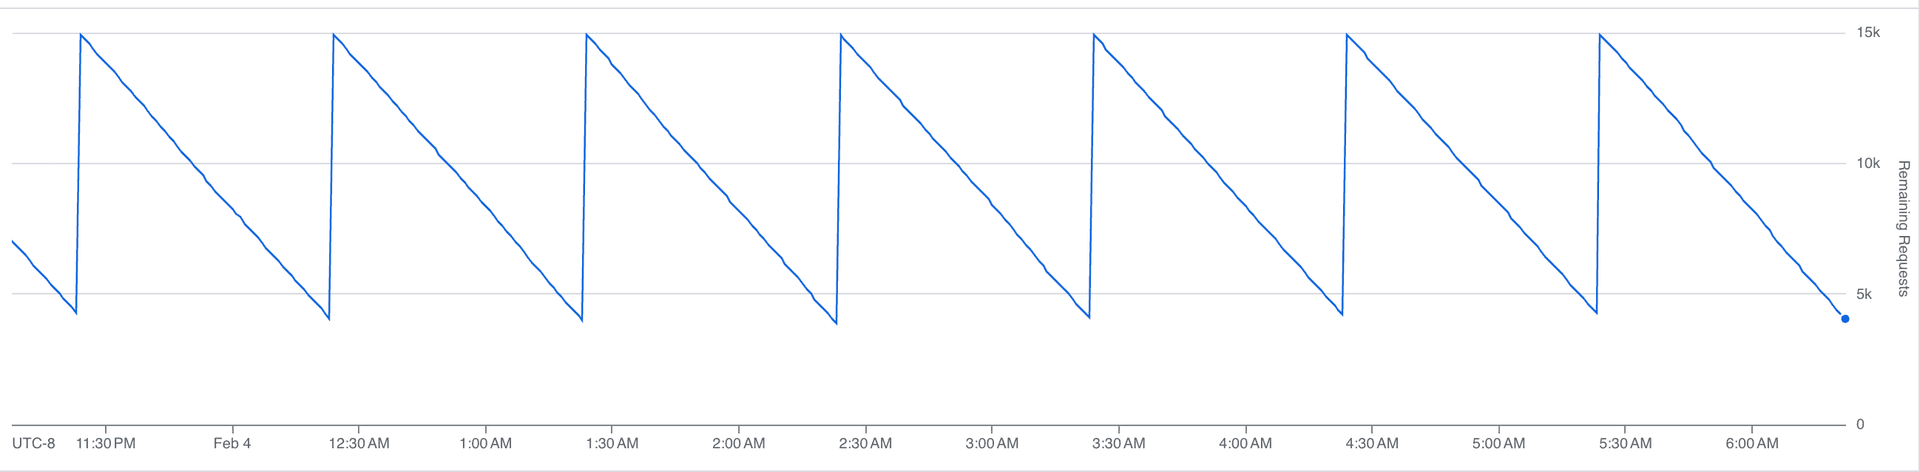
That sawtooth is the steady state. Each downward slope is us consuming API calls; each vertical jump is the hourly limit resetting. At peak, we burn through most of the budget before the window resets, with headroom left for the agent.
Once we trusted the throttling, we pushed the ingestion rate about 20% higher:
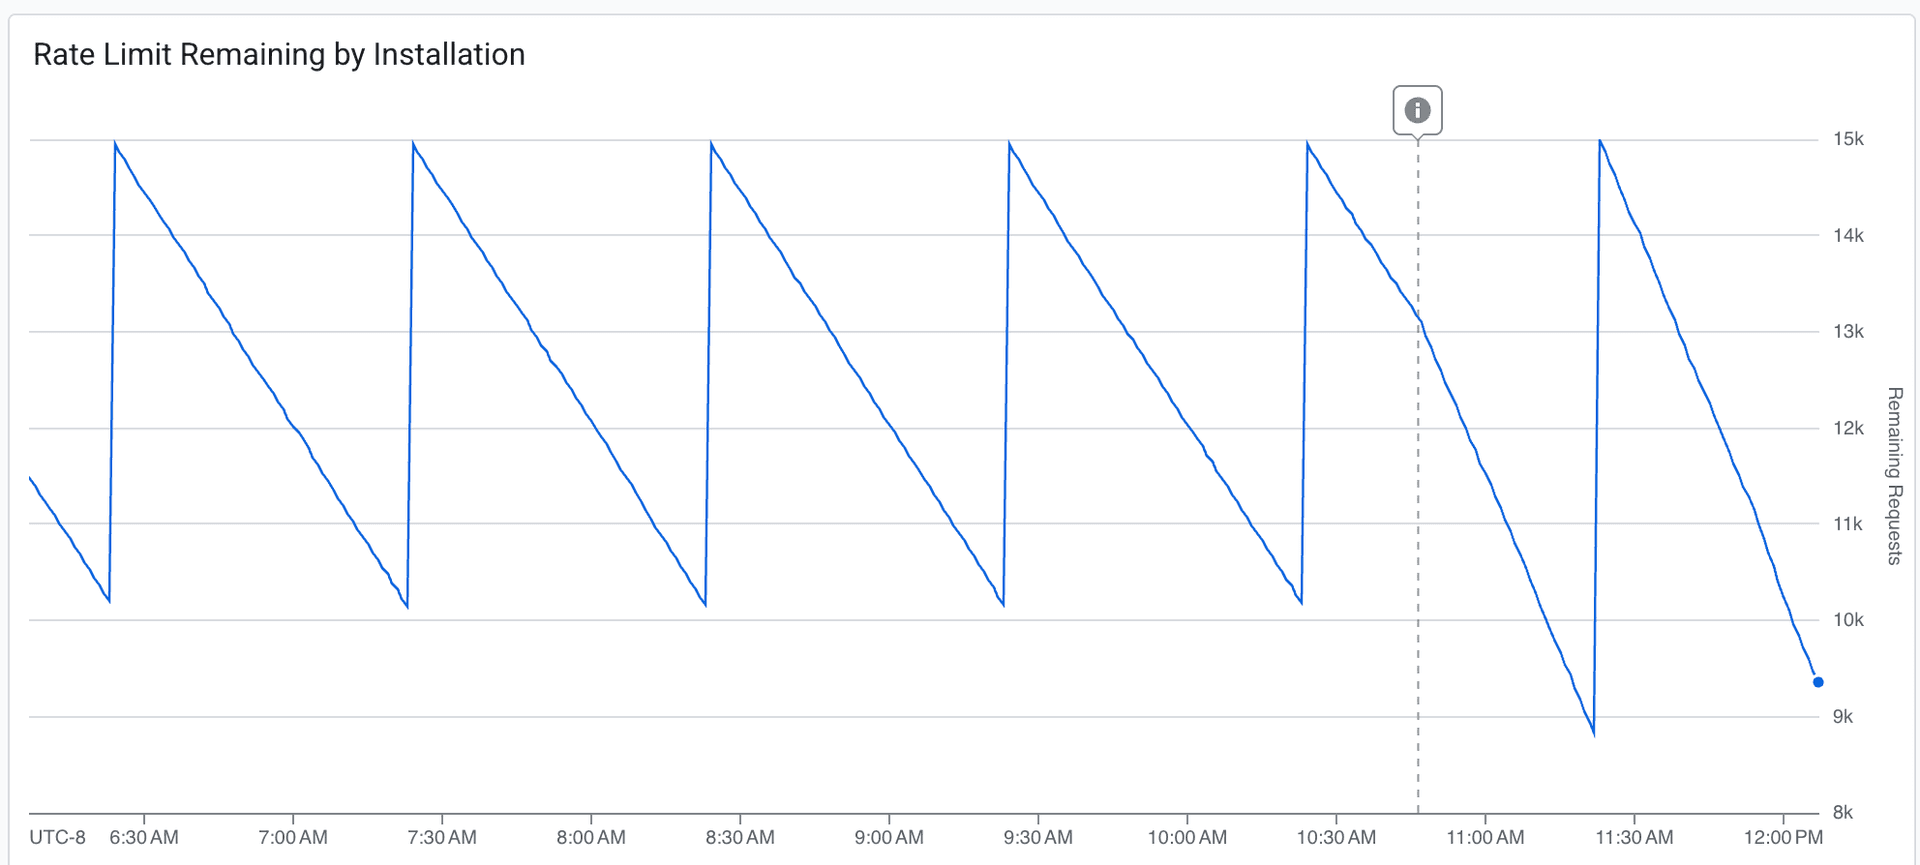
The dashed line marks the deployment. The budget draws down more aggressively after the change. We're consuming more of the available headroom per window, while still never fully exhausting it. Fresher data, acceptable margin.
We target under 5 minutes at P95 for ingestion delay, the time between an event happening on GitHub and it being queryable in our system. Most of the time, we're at a few seconds.
Durable execution
Both our ingestion pipeline and our agent run on Inngest, a durable execution engine. When either one hits a rate limit, it doesn't crash, retry blindly, or spin in a loop. It suspends.
GitHub's rate limit response headers tell you exactly how long you need to wait. We read that value, add 10% jitter to avoid a thundering herd when the limit resets, and suspend the execution. The full state is checkpointed: progress through the workflow, which jobs have been fetched, where we are in the log pagination.
When the wait is over, execution resumes at exactly the point it left off. No re-initialization, no duplicate work. It picks up the next API call as if nothing happened.
Compare this to the alternative: retry logic, state recovery, deduplication. Every function needs to be idempotent. Every interrupted batch needs to be reconciled. With durable execution, the rate limit is just a pause button.
Absorbing traffic spikes
CI activity is bursty. Someone merges a big PR, a release branch gets cut, three teams push at the same time. Our function throughput:
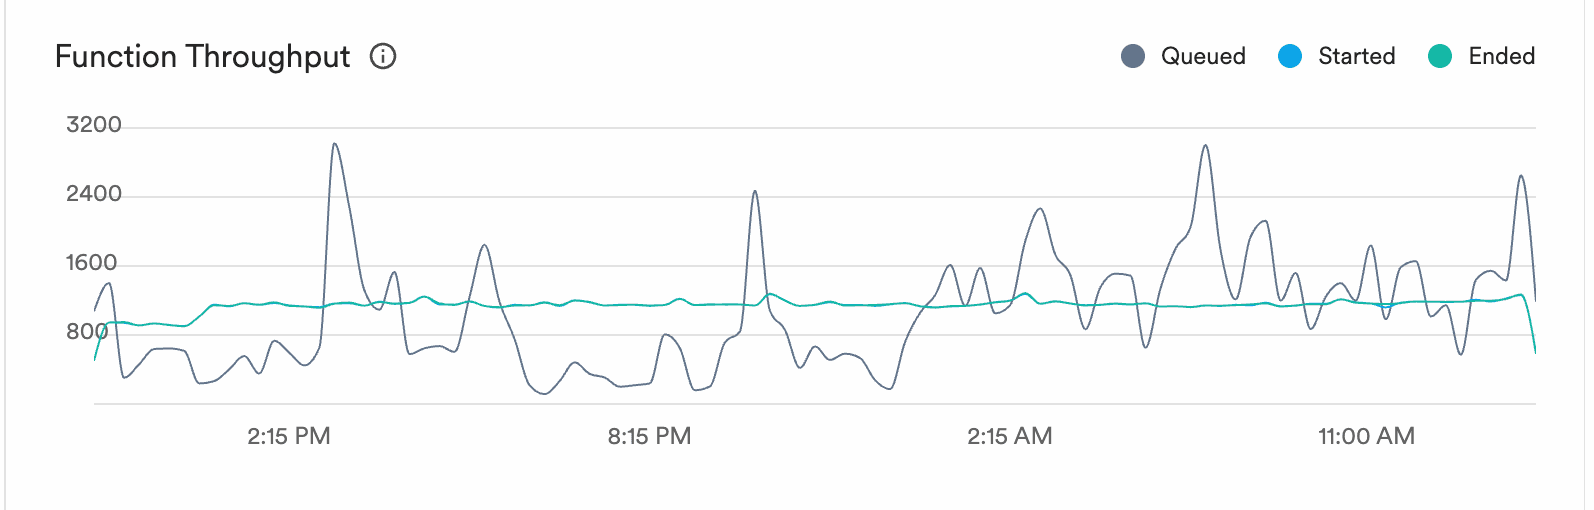
The grey line is queued work. It spikes to 3,000+ during bursts of CI activity. The blue and green lines (started and ended) stay smooth at 800-1,000. The execution engine absorbs the spikes and processes work at a steady rate.
Ingestion delay over time:
Spikes during peak activity, but the system recovers. The 5-minute P95 target holds: bursts push delay up briefly, then it drops back to seconds once the queue drains.
Nobody puts "we built a really good rate limiter" on their landing page. But without fresh, queryable data, your agent can't answer the question that actually matters: did I break this, or was it already broken?
We're building Mendral (YC W26). We spent a decade building and scaling CI systems at Docker and Dagger, and the work was always the same: stare at logs, correlate failures, figure out what changed. Now we're automating it.
Read the original article
Comments
I just wrote a tool for reducing logs for LLM analysis (https://github.com/ascii766164696D/log-mcp)
Lots of logs contain non-interesting information so it easily pollutes the context. Instead, my approach has a TF-IDF classifier + a BERT model on GPU for classifying log lines further to reduce the number of logs that should be then fed to a LLM model. The total size of the models is 50MB and the classifier is written in Rust so it allows achieve >1M lines/sec for classifying. And it finds interesting cases that can be missed by simple grepping
I trained it on ~90GB of logs and provide scripts to retrain the models (https://github.com/ascii766164696D/log-mcp/tree/main/scripts)
It's meant to be used with Claude Code CLI so it could use these tools instead of trying to read the log files
Mendral co-founder here and author of the post.
This is an interesting approach. I definitely agree with the problem statement: if the LLM has to filter by error/fatal because of context window constraints, it will miss crucial information.
We took a different approach: we have a main agent (opus 4.6) dispatching "log research" jobs to sub agents (haiku 4.5 which is fast/cheap). The sub agent reads a whole bunch of logs and returns only the relevant parts to the parent agent.
This is exactly how coding agents (e.g. Claude Code) do it as well. Except instead of having sub agents use grep/read/tail, they use plain SQL.
yeah, I saw Claude Code doing lots of grepping/find and was curious if that approach might miss something in the log lines or if loading small portion of interesting log lines into the context could help. I find frequently that just looking at ERROR/WARN lines is not enough since some might not actually be errors and some other skipped log lines might have something to look into.
And I just wanted to try MCP tooling tbh hehe Took me 2 days to create this to be honest
From our experience running this, we're seeing patterns like these:
- Opus agent wakes up when we detect an incident (e.g. CI broke on main)
- It looks at the big picture (e.g. which job broke) and makes a plan to investigate
- It dispatches narrowly focused tasks to Haiku sub agents (e.g. "extract the failing log patterns from commit XXX on job YYY ...")
- Sub agents use the equivalent of "tail", "grep", etc (using SQL) on a very narrow sub-set of logs (as directed by Opus) and return only relevant data (so they can interpret INFO logs as actually being the problem)
- Parent Opus agent correlates between sub agents. Can decide to spawn more sub agents to continue the investigation
It's no different than what I would do as a human, really. If there are terabytes of logs, I'm not going to read all of them: I'll make a plan, open a bunch of tabs and surface interesting bits.
By prescriptivist 2026-02-2718:561 reply I have an agent system analyzing time series data periodically. What I've landed on is the tools themselves pre-process time series data, giving it more semantic meaning. AKA converting timestamps to human dates, additionally preprocessing it with statistical analysis, such as calculating current windows min/mean/max value for the series as well as a the same for a trailing window and surfacing those in the data. Also adding a volatility score, and doing things like collapsing runs of similar series that aren't particularly interesting from a volatility perspective and just trying to highlight anomalous series in the window in various ways.
This isn't anything new. It's not particularly technical or novel in any way, but it seems to work pretty well for identifying anomalies and comparing series over time horizons. It's even less token efficient on small windows than piping in a bunch of json, but it seems to be more effective from an analysis point of view.
The strange thing about it is that it involves fairly deterministic analysis before we even send the data to the LLM, so one might ask, what's the point if you're already doing analysis? The answer is that LLMs can actually find interesting patterns across a lot of well presented data, and they can pick up on patterns in a way that feels like they are cross-referencing many different time series and correlate signals in interesting ways. That's where the general purpose LLMs are helpful in my experience.
Breaking out analysis into sub-agents is a logical next step, we just haven't gotten there yet.
And yeah the goal is to approximate those of us engineers who are good at RCAs in the moment, who have instincts about the system and can juggle a bunch of tabs and cross reference the signals in them.
This was my approach when using agents to analyze HVAC IoT data doing anomaly detection / investigations and it similarly worked very well. Mix that with some context like install location, geographic features with some context / info on seasonality (like ASHRAE values for the regions), and some classification like (residential / commercial), the bot was quite able to deliver actual insights into problems vs creating a bunch of excess noise.
We also mixed in some GSA (https://arxiv.org/abs/2503.04104) steps during the analysis in the sub agents to further reduce hallucinations
By prescriptivist 2026-03-0120:43 Glad to hear this. I actually went down this path based off of guidance from multiple LLMs (Anthropic, OpenAI, etc.), so I wasn't sure if it was just some kind of weird hallucination they all had or if they were regurgitating a very small amount of knowledge on this topic, because it was kinda hard to find stories where people had success with these strategies. Thank you for the link to the paper. I will definitely be reading it.
By azinman2 2026-02-2719:28 So how can this be a company when it’s just what Claude code already does?
By almosthere 2026-02-2720:59 You may want to also have your agents write small scripts that auto flag future logs.
Have an array of scripts to run against each log (just rust code probably for speed) and have them flag for performance, errors, intrusions, etc...
By synergy20 2026-02-2812:20 did you create the subagent yourself?claude's agent never called haiku in my case
Do you think it could do anything interesting with a highly compressed representation? CLP can apparently achieve 169x compression ratio:
https://github.com/y-scope/clp
https://www.uber.com/blog/reducing-logging-cost-by-two-order...
interesting approach, thanks for directing me!
Since the classifier would need to have access to the whole log message I was looking into how search is organized for the CLP compression and see that:
> First, recall that CLP-compressed logs are searchable–a user query will first be directed to dictionary searches, and only matching log messages will be decompressed.
so then yeah it can be combined with a classifier as they get decompressed to get a filtered view at only log lines that should be interesting.
The toughest part is still figuring out what does "interesting" actually mean in this context and without domain knowledge of the logs it would be difficult to capture everything. But I think it's still better than going through all the logs post searching.
I like the idea of SQL as the "common tongue" because provided the query is reasonably terse it's easy for the human to verify and reason about, there's shitloads of it in the LLM's training set, and (usually) the database doesn't lie. So you've mitigated some major LLM drawbacks that way.
Another thing SQL has in it's favor is the ability with tools like trino or datafusion to basically turn "everything" into a table.
EDIT: thinking on it some more, though, at what point do you just know off the top of your head the small handful of SQL queries you regularly use and just skip the expensive LLM step altogether? Like... that's the thing that underwhelms me about all the "natural language query" excitement. We already have a very good, natural language for queries: SQL.
By chickensong 2026-02-2720:021 reply > small handful of SQL queries you regularly use
Give those queries to the LLM and enjoy your sleep while the agent works.
By jcgrillo 2026-02-2722:16 hell yeah, give it the ssh keys too and sleep all the time
By ManuelKiessling 2026-02-2717:582 reply https://github.com/dx-tooling/platform-problem-monitoring-co... could have a useful approach, too: it finds patterns in log lines and gives you a summary in the sense of „these 500 lines are all technically different, but they are all saying the same“.
By buryat 2026-02-2718:07 the patter matcher is interesting to also collapse log lines and compare that between runs, thank you!
In my tool I was going more of a premise that it's frequently difficult to even say what you're looking for so I wanted to have some step after reading logs to say what should be actually analyzed further which naturally requires to have some model
very interesting, curious if there is any downside to running this at scale (compute?)
By generallyjosh 2026-02-280:33 I'd assume it probably depends how large and varied your logs are?
But, my guess, I could see an algorithm like that being very fast. It's basically just doing a form of compression, so I'm thinking ballpark, like similar amount to just zipping the log
Can't be anything CLOSE to the compute cost of running any part of the file through an LLM haha
But does it work? I’ve used LLMs for log analysis and they have been prone to hallucinate reasons: depending on the logs the distance between cause and effects can be larger than context, usually we’re dealing with multiple failures at once for things to go badly wrong, and plenty of benign issues throw scary sounding errors.
Post author here.
Yes, it works really well.
1) The latest models are radically better at this. We noticed a massive improvement in quality starting with Sonnet 4.5
2) The context issue is real. We solve this by using sub agents that read through logs and return only relevant bits to the parent agent’s context
By tclancy 2026-02-281:07 Not from AI no.
I would be very interested in reading about this kind of orchestration and filtering than data acquisition if you have the energy for another post :)
By shad42 2026-02-2716:48 We started writing very recently: https://www.mendral.com/blog - there is a another post we made yesterday about the overall architecture. And we have a long list of things we're planning to write about in more details.
Taking good note of your comment :)
By aluzzardi 2026-02-2718:01 We've actually started to gather metrics this week to write that exact post :) Coming soon!
By huflungdung 2026-02-2717:22 [dead]
By cgfjtynzdrfht 2026-02-2719:07 [dead]
It can, like all the other tasks, it's not magic and you need to make the job of the agent easier by giving it good instructions, tools, and environments. It's exactly the same thing that makes the life of humans easier too.
This post is a case study that shows one way to do this for a specific task. We found an RCA to a long-standing problem with our dev boxes this week using Ai. I fed Gemini Deep Research a few logs and our tech stack, it came back with an explanation of the underlying interactions, debugging commands, and the most likely fix. It was spot on, GDR is one of the best debugging tools for problems where you don't have full understanding.
If you are curious, and perhaps a PSA, the issue was that Docker and Tailscale were competing on IP table updates, and in rare circumstances (one dev, once every few weeks), Docker DNS would get borked. The fix is to ignore Docker managed interfaces in NetworkManager so Tailscale stops trying to do things with them.
> it's not magic and you need to make the job of the agent easier by giving it good instructions, tools, and environments.
This. We had much better success by letting the agent pull context rather trying to push what we thought was relevant.
Turns out it's exactly like a human: if you push the wrong context, it'll influence them to follow the wrong pattern.
By verdverm 2026-02-2723:57 I'd put it somewhere in the middle, but closer to the pull end.
- I force the AGENTS.md into the system prompt if the agent reads a directory, or file within, that contains one such file. This is anecdotally very good and saves on function calls and context growth in multiple ways. Sort them. I'm now doing this with planning and long-term task tracking markdown files.
- Everything else is pull, ideally be search, yet to substantially leverage subagents for context gathering. Savings elsewhere have pushed the need out.
btw, hi Al, I see you are working on a new company since our last collaboration, want to catch up sometime and talk shop?
By sollewitt 2026-02-2716:50 Thanks - that’s the maddening with flakes - is it the thing under test or the thing doing the testing? Hermeticity is a lie we tell ourselves :)
By shad42 2026-02-2716:32 Mendral co-founder here, we built this infra to have our agent detect CI issues like flaky tests and fix them. Observing logs are useful to detect anomalies but we also use those to confirm a fix after the agent opens a PR (we have long coding sessions that verifies a fixe and re-run the CI if needed, all in the same agent loop).
So yes it works, we have customers in production.
By hardolaf 2026-02-2821:15 I can't get an LLM to properly handle analyzing a single 200K+ line log without making things up so whatever anyone is saying about this "working" is probably a lie.
By kburman 2026-02-2717:33 Honestly, with recent models, these types of tasks are very much possible. Now it mostly depends on whether you are using the model correctly or not.
My first take is that you could have 10 TB of logs with just a few unique lines that are actually interesting. So I am not thinking "Wow, what impressive big data you have there" but rather "if you have an accuracy of 1-10^-6 you are still are overwhelmed with false positives" or "I hope your daddy is paying for your tokens"
Yeah this is my experience with logs data. You only actually care about O(10) lines per query, usually related by some correlation ID. Or, instead of searching you're summarizing by counting things. In that case, actually counting is important ;).
In this piece though--and maybe I need to read it again--I was under the impression that the LLM's "interface" to the logs data is queries against clickhouse. So long as the queries return sensibly limited results, and it doesn't go wild with the queries, that could address both concerns?
By NewsaHackO 2026-02-2718:454 reply What does O(10) mean?
By nahumfarchi 2026-02-2718:591 reply Mathematically, it means that the number of lines read is bounded by 10*M, where M is some constant. So it's basically equivalent to saying that it's O(1).
I'm guessing that intention was to say "around 10 lines", though it kind of stretches the definition if we're being picky.
By PaulHoule 2026-02-2719:19
I normally see that from engineers using "O(x)" as "approximately x" whenever it's clear from context that you're not actually talking about asymptomatic complexity.
I've always thought it was like this, maybe I'm wrong:
O(some constant) -- "nearby" that constant (maybe "order of magnitude" or whatever is contextually convenient)
O(some parameter) -- denotes the asymptotic behavior of some parametrized process
O(some variable representing a small number) -- denotes the negligible part of something that you're deciding you don't have to care about--error terms with exponent larger than 2 for example
Those last two notations are, formally, the same. To call a part negligible, we say it's asymptotically bounded above by a constant multiple of this expression, which obviously goes away as we approach the limit. The first one is a colloquial alternative definition that would probably be considered "wrong" in formal writing.
By jcgrillo 2026-02-2719:50 Agreed
By unfunco 2026-02-2719:40 I think the O means order of magnitude. It looks like Big O notation, but O(10) would collapse to O(1) and OP is not talking about efficiency anyway.
By PaulHoule 2026-02-2718:57 "about 10"
Mendral co-founder and post author here.
I agree with your statement and explained in a few other comments how we're doing this.
tldr:
- Something happens that needs investigating
- Main (Opus) agent makes focused plan and spawns sub agents (Haiku)
- They use ClickHouse queries to grab only relevant pieces of logs and return summaries/patterns
This is what you would do manually: you're not going to read through 10 TB of logs when something happens; you make a plan, open a few tabs and start doing narrow, focused searches.
By hardolaf 2026-02-2821:18 In my systems, I just go to an error log that gets posted to a Slack channel then go to the the log file and grep for full message that got dumped to Slack. That then gives me everything that happened before and a state dump after. That state dump can be given to a program to tell us if any state errored and what happened before tells us what the expectation was and what the precise error was. Using a LLM would just be slower and more expensive for this.
